Finance & Stock Market learnings
06 Jul 2025Read educational articles online from Zerodha Varsity, Upstox, Groww, Smallcase followed folks on Youtube/Twitter/WebArticles, asked doubts to GPT etc., and wrote below notes.
In this article I will write about my learnings around indian stock market, fundamental & technical analysis of stocks, etc., which I have been doing for some months. Although, work keeps me busy, I try my best to keep track of the markets and rotate my finances whenever necessary.
Table of Contents
- Table of Contents
- Market Fundamentals
- Market Jargon
- Investment Instruments
- Technical Ratios and Metrics
- Tax Saving Strategy
- Futures Options
- Other Info
Market Fundamentals
Market Structure and Infrastructure
Stock Exchanges
India operates two primary stock exchanges that form the backbone of its capital markets:
- Bombay Stock Exchange (BSE): Established in 1875, it’s Asia’s oldest stock exchange and home to the benchmark Sensex index
- National Stock Exchange (NSE): Founded in 1992, it’s India’s largest exchange by trading volume and hosts the popular Nifty 50 index
Both exchanges operate under strict regulatory oversight and provide electronic trading platforms for seamless transactions.
Market Participants
The Indian stock market ecosystem comprises diverse participants, each playing a vital role:
Individual Investors
- Domestic Retail Participants: Individual investors like retail traders and long-term investors
- Non-Resident Indians (NRIs) and Overseas Citizens of India (OCIs): People of Indian origin residing abroad who can invest through designated channels
Institutional Investors
- Domestic Institutions: Corporate entities and organizations based in India
- Domestic Asset Management Companies (AMCs): Mutual fund companies such as SBI Mutual Fund, HDFC AMC, ICICI Prudential, and Axis Mutual Fund
- Foreign Institutional Investors (FIIs) and Foreign Portfolio Investors (FPIs): International entities including foreign asset management companies, hedge funds, pension funds, and sovereign wealth funds
Regulatory Framework
The Securities and Exchange Board of India (SEBI) serves as the market regulator, ensuring:
- Fair and transparent trading practices
- Investor protection
- Market integrity and stability
- Compliance with prescribed rules and regulations
SEBI continuously updates regulations to align with global best practices and protect investor interests.
Market Intermediaries and Account Structure
Essential Intermediaries
Your journey in the stock market involves three key intermediaries:
1. Stockbrokers
Your gateway to market access, stockbrokers enable you to:
- Buy and sell stocks, bonds, ETFs, and mutual funds
- Access research and market insights
- Provide trading platforms and tools
- Offer advisory services
2. Depositories
Financial intermediaries offering Demat (Dematerialized) account services:
- National Securities Depository Limited (NSDL)
- Central Depository Services (India) Limited (CDSL)
Both operate under SEBI regulations with virtually no functional differences. The Demat account holds your securities in electronic format, replacing the old paper certificate system (pre-1996).
3. Banks
Provide the bank account for fund transfers and settlements.
The Three-Account System
Successful trading requires three interconnected accounts:
- Trading Account: Provided by your broker for placing orders
- Demat Account: Offered by depository participants for holding securities
- Bank Account: For fund transfers and settlements
All three accounts operate electronically and are seamlessly integrated for smooth transactions.
Clearing and Settlement
NSE Clearing Limited and Indian Clearing Corporation (ICCL) are wholly-owned subsidiaries of NSE and BSE respectively. These clearing corporations ensure guaranteed settlement of all trades, providing counterparty risk protection to investors.
Market Timings and Sessions
Understanding market timings is crucial for effective trading and investment decisions.
Pre-Opening Session (9:00 AM - 9:15 AM)
This session sets the stage for the trading day through three distinct phases:
Order Entry Period (9:00 AM - 9:08 AM)
- Place, modify, or cancel orders for any securities
- Orders placed during this time receive priority when trading begins
- Beneficial for strategic positioning before market opens
Price Discovery (9:08 AM - 9:12 AM)
- No new orders or modifications allowed
- System determines opening prices through multilateral order matching
- Matches buy and sell orders based on demand and supply
- Critical for establishing fair opening prices
Transition Period (9:12 AM - 9:15 AM)
- Buffer time between pre-opening and normal trading
- No new orders allowed
- Existing orders cannot be modified or cancelled
- System prepares for normal trading session
Normal Trading Session (9:15 AM - 3:30 PM)
The primary trading session where:
- All regular transactions occur
- Bilateral order matching system operates
- Real-time price discovery based on demand and supply
- Maximum market liquidity and activity
Post-Closing Session (3:30 PM - 4:00 PM)
Closing Price Calculation (3:30 PM - 3:40 PM)
- Closing prices calculated using weighted average of prices from 3:00 PM - 3:30 PM
- Benchmark indices (Nifty, Sensex) closing values determined
- Important for next day’s reference pricing
After-Market Orders (3:40 PM - 4:00 PM)
- Place orders for next day’s trading
- Orders execute at predetermined prices regardless of next day’s opening
- Provides opportunity for price discovery after regular hours
- Orders can be cancelled during early pre-opening session (9:00 AM - 9:08 AM) if needed
Special Trading Sessions
Muhurat Trading: Despite being generally closed on Diwali, the market opens for one ceremonial hour during this auspicious festival, allowing investors to make symbolic investments.
Types of Market Participants by Trading Style
Day Traders
- Initiate and close positions within the same trading day
- Do not carry positions overnight
- Focus on short-term price movements
- Require active monitoring and quick decision-making
Scalpers (Subset of Day Traders)
- Hold positions for very short periods (minutes to hours)
- Trade large volumes for small but quick profits
- Require excellent timing and market understanding
Swing Traders
- Hold positions for several days to weeks
- Capitalize on medium-term price movements
- Less time-intensive than day trading
- Focus on technical patterns and trends
Long-term Investors
- Hold positions for months to years
- Focus on fundamental analysis
- Benefit from compounding and dividend income
- Less affected by short-term market volatility
Order Types and Trading Strategies
Understanding different order types is essential for executing your investment strategy effectively.
Basic Order Types
Market Order
- Executes immediately at the best available market price
- Higher probability of execution
- Price may vary from expected due to market movements
- Example: Placing order for ₹100 might execute at ₹105 (higher) or ₹95 (lower)
Limit Order
- Executes only at specified price or better
- Lower probability of execution
- Provides price certainty
- Example: Limit order at ₹100 will only execute at ₹100 or favorable price
Stop Loss Order
- Triggered when stock reaches predetermined price level
- Limits losses or protects profits
- Two variants:
- Stop Loss Market (STM): Converts to market order when triggered (higher execution probability)
- Stop Loss Limit (STL): Converts to limit order when triggered (execution not guaranteed)
Advanced Order Types
Cover Order
- Combination of buy order with automatic stop loss
- Provides built-in risk management
- Formula: Cover Order = Buy Price + Stop Loss
Bracket Order
- Most comprehensive order type
- Includes entry, stop loss, and target price
- Formula: Bracket Order = Buy Price + Stop Loss + Target Price
- Automatically exits position at either stop loss or target
After Market Order (AMO)
- Orders placed after market closure
- Executed when market reopens next day
- Price difference possible between order placement and execution
- Useful for capturing overnight news impact
Immediate-or-Cancel (IOC) Order
- Must execute immediately or get cancelled
- Partial execution possible
- Example: Order for 100 shares might execute 60 shares, cancel remaining 40
Day Order vs. Good-Till-Cancelled (GTC)
- Day Order: Valid until end of trading day
- Good-Till-Day: Valid until specified day
- Good-Till-Cancelled: Valid until manually cancelled or expiry date
Delivery vs. Intraday Trading
Delivery Trading
- Shares transferred to your Demat account
- Suitable for long-term investment
- Full payment required upfront
- Dividend and corporate action benefits
Intraday Trading
- Positions squared off same day
- No share delivery
- Margin trading available (leverage)
- Higher risk due to leverage
- Lower capital requirement initially
Clearing and Settlement Process
Understanding the settlement cycle is crucial for planning your trades and managing cash flows.
T+2 Settlement Cycle
T Day (Trade Day)
- Transaction execution day
- Money debited from account immediately
- Shares not yet in Demat account
- Broker generates contract note (transaction bill)
- All charges and taxes applied
T+1 Day
- Exchange processes the transaction
- Shares still not in Demat account
- BTST/ATST Trading Possible: Can sell shares bought previous day (high risk)
- Risk: If original seller defaults, you face auction penalty (up to 20% of stock value)
T+2 Day
- Final settlement day
- Shares credited to Demat account
- Money settlement completed
- Transaction officially closed
T+3 Day
- Shares available for trading without restrictions
- Full ownership rights activated
Important Note: Bank or depository holidays on T+2 may delay settlement, but shares still appear in T1 holdings.
Corporate Actions
Corporate actions significantly impact your investments and require understanding for informed decision-making.
Dividends
Companies share profits with shareholders through dividend payments.
Dividend Process Timeline
- Dividend Declaration Date: Board approves dividend at Annual General Meeting (AGM)
- Record Date: Company reviews shareholder register (typically 30 days after declaration)
- Ex-Dividend Date: Set two business days before record date due to T+2 settlement
- Payment Date: Actual dividend distribution
Key Concepts
- Cum-Dividend: Trading with dividend rights (before ex-date)
- Ex-Dividend Impact: Stock price typically drops by dividend amount on ex-date
- Eligibility: Must own shares before ex-dividend date to receive dividend
Example: If ITC trading at ₹335 declares ₹5 dividend, price drops to approximately ₹330 on ex-date.
Bonus Shares
Free additional shares given to existing shareholders in fixed ratios.
Common Ratios
- 1:1: One bonus share for every share held
- 2:1: Two bonus shares for every share held
- 3:1: Three bonus shares for every share held
Benefits
- Increases shareholding without additional cost
- Makes shares more affordable for retail investors
- Maintains proportional ownership
Stock Split
Increases number of shares while proportionally reducing share price.
Mechanism
- 2-for-1 Split: Each share becomes two shares at half the price
- Face Value Reduction: Reduces in same proportion as split
- Market Capitalization: Remains unchanged
Reverse Stock Split: Combining shares (negative indicator for company health)
Rights Issue
Opportunity for existing shareholders to buy additional shares at discounted price.
Features
- Offered below market price
- Maintains proportional ownership if fully subscribed
- Can be traded, renounced, or partially exercised
- Similar to secondary IPO for existing shareholders
Share Buyback
Company repurchases its own shares from the market.
Benefits
- Reduces shares outstanding
- Potentially increases share price
- Shows management confidence
- Returns excess cash to shareholders
- Improves financial ratios like EPS
Investment Considerations and Tax Implications
Financial Year and Tax Structure
India’s financial year runs from April 1st to March 31st, affecting your tax planning.
Important Terminology
- Financial Year (FY): Year in which income is earned
- Assessment Year (AY): Year in which taxes are filed
- Example: FY 2023-24 income filed in AY 2024-25
Tax Participation Context
Only about 5% of India’s 130+ crore population files income tax returns, with less than 1.5% actually paying income tax. This compares to over 45% in developed economies like the USA, highlighting the growth potential of India’s formal economy.
Alternative Investment Avenues
Commodity Markets
India offers robust commodity trading through multiple exchanges:
Major Commodity Exchanges
- Multi Commodity Exchange (MCX): Largest commodity exchange
- Intercontinental Exchange (ICE): International commodity platform
- National Commodity and Derivatives Exchange (NCDEX): Agricultural commodities focus
- National Multi Commodity Exchange (NMCE): Regional commodity trading
Commodity Categories
- Metals: Gold, silver, copper, aluminum, zinc
- Energy: Crude oil, natural gas, heating oil
- Agricultural: Wheat, rice, sugar, cotton, spices
- Others: Industrial commodities and rare earth materials
Derivatives Market
Futures and Options (F&O)
- Advanced instruments for hedging and speculation
- Require margin payments instead of full amount
- Higher leverage and risk
- Suitable for experienced investors
Market Jargon
Basic Trading Terms
Position Management
Square Off: The action of closing an existing position by executing an opposite transaction. Think of it as completing a trade cycle - if you bought shares, you square off by selling them, and vice versa.
Long Position: When you buy and hold securities expecting their price to rise. You’re “long” on optimism about the asset’s future performance.
Short Position: When you sell securities you don’t own (borrowed through your broker) expecting their price to fall. You profit when you can buy them back at a lower price to return to the lender.
Price Reference Points
Last Traded Price (LTP): The most recent price at which a stock was traded. This gives you a real-time snapshot of market valuation and serves as the starting point for your next trade decision.
52-Week High/Low: The highest and lowest prices a stock has reached in the past year. These levels often act as psychological barriers and reference points for investors to gauge whether a stock is expensive or cheap relative to its recent history.
All-Time High/Low: The highest or lowest price a stock has ever reached since it began trading. Breaking these levels often signals significant market events or company developments.
OHLC Data: Open, High, Low, and Close prices that summarize a stock’s price movement during a specific time period (day, week, month). This data helps you understand the trading range and price volatility, forming the basis for technical analysis.
Trading Mechanisms
Volume: The number of shares traded during a specific period. High volume often indicates strong interest and conviction in price movements, while low volume suggests uncertainty or lack of interest.
Upper Circuit/Lower Circuit: Price bands set by exchanges that limit how much a stock can move up or down in a single trading session. These circuits prevent extreme volatility and give investors time to react to news. When a stock hits an upper circuit, it can only move up to that level, and when it hits a lower circuit, it cannot fall below that price.
Market Conditions and Sentiment
Bull and Bear Markets
Bull Market: A period of rising prices and optimistic investor sentiment. Like a bull that attacks by thrusting upward, prices move higher. Bull markets are characterized by strong economic fundamentals, high employment, and investor confidence.
Bear Market: A period of declining prices and pessimistic sentiment. Like a bear that attacks by swiping downward, prices fall. Bear markets typically involve economic uncertainty, rising unemployment, and widespread selling pressure.
Financial Performance Metrics
Company Fundamentals
Topline: A company’s total revenue or sales figures, appearing at the top of the income statement. This represents the company’s ability to generate business and market share.
Bottomline: The net profit after all expenses, taxes, and costs have been deducted from revenue. This appears at the bottom of the income statement and represents the actual money the company earned for shareholders.
Earnings Per Share (EPS): Net profit divided by the number of outstanding shares. This metric helps you understand how much profit each share represents. A higher EPS generally indicates better profitability per share, but it should be compared with industry peers and historical performance.
Stock Performance Indicators
Alpha: Measures how much a stock outperforms or underperforms compared to a benchmark index like Nifty or Sensex. A positive alpha means the stock performed better than the index, while negative alpha indicates underperformance.
Beta: Measures a stock’s volatility relative to the overall market. A beta of 1 means the stock moves in line with the market, above 1 indicates higher volatility, and below 1 suggests lower volatility than the market.
Investment Strategies and Concepts
Trading Approaches
Momentum Investing: A strategy that involves buying securities showing upward price trends and selling those showing downward trends. This approach assumes that trends will continue in the short term, riding the wave of market sentiment.
Tax Gain/Loss Harvesting: A strategic approach to minimize tax liability by timing the sale of investments. For gains, you can sell investments just before they exceed the tax-free threshold and reinvest immediately to reset the cost basis. For losses, you can book losses to offset future gains, effectively reducing your tax burden.
Investment Returns
Dividends: Regular payments companies make to shareholders from their profits. Think of dividends as your share of the company’s success. There are two ways to earn from investments: capital appreciation (stock price increase) and dividend income (regular payments).
Capital Appreciation: The increase in an investment’s value over time. This represents the difference between what you paid for an asset and its current market value.
Taxation Framework
Capital Gains Tax Structure
Long Term Capital Gains (LTCG) Tax: Applied to profits from stocks held for more than one year. Long-Term Capital Gains (LTCG) on shares and equity-oriented mutual funds in India are taxed at a 12.5% rate (plus surcharge and cess) if they reach Rs. 1.25 lakh in a fiscal year.
Short Term Capital Gains (STCG) Tax: Applied to profits from stocks held for one year or less. Currently, short term capital gains on shares are taxed at a rate of 20% under Section 111A with effect from 23 July 2024.
Dividend Taxation
Since April 2020, dividends are taxed as per your income tax slab rather than being tax-free.
Monetary Policy and Economic Indicators
Interest Rate Framework
Repo Rate: The rate at which the Reserve Bank of India lends money to commercial banks. When RBI increases repo rates, borrowing becomes expensive, reducing money supply and potentially slowing economic growth. Stock markets typically react negatively to repo rate increases.
Reverse Repo Rate: The rate at which RBI borrows money from banks. This tool helps RBI absorb excess liquidity from the banking system.
Cash Reserve Ratio (CRR): The percentage of deposits that banks must maintain with RBI. Higher CRR reduces money available for lending, tightening liquidity in the economy.
Banking Metrics
Credit to Deposit Ratio (CD Ratio): Measures how much of banks’ deposits are being lent out. A higher ratio indicates aggressive lending, while a lower ratio suggests conservative banking practices. This affects credit availability and economic growth.
Economic Health Indicators
Inflation: The sustained increase in general price levels. India typically targets inflation around 4-6%. Moderate inflation indicates healthy economic growth, while high inflation erodes purchasing power and can negatively impact stock markets.
Index of Industrial Production (IIP): Measures the performance of India’s industrial sector, including manufacturing, mining, and electricity. It provides insights into economic activity and industrial growth trends.
Purchasing Managers’ Index (PMI): A leading indicator of economic health based on surveys of purchasing managers in manufacturing and services sectors. A PMI above 50 indicates expansion, while below 50 suggests contraction.
Consumer Price Index (CPI): Measures inflation by tracking changes in prices of goods and services consumed by households. This directly impacts interest rate decisions and monetary policy.
Government Securities and Safe Investments
Treasury Bills
Short-term government securities with maturities of 91, 182, or 364 days. These are considered the safest investments as they’re backed by the government. They’re sold at a discount to face value and redeemed at full value, with the difference representing your return.
Example: A 91-day treasury bill with face value ₹120 might be available at ₹118.40. After 91 days, you receive ₹120, earning ₹1.60 as profit.
Understanding Market Indices
What is an Index?
A stock index represents a group of shares that collectively indicate the performance of a sector, exchange, or economy. Think of it as a representative sample that tells you how the overall market is performing.
Examples:
- Nifty 50: Represents the top 50 companies by market capitalization on NSE
- Sensex: Represents 30 large-cap companies on BSE
- Bank Nifty: Represents banking sector performance
Indices serve as benchmarks for mutual funds and help investors understand market trends without analyzing individual stocks.
Understanding IPOs
-
What is an IPO: Initial Public Offering marks a private company’s transformation into a public entity, allowing anyone to buy shares through stock exchanges
-
Why Companies Go Public:
- Financial reasons: Raise capital without debt, avoid interest payments, get better valuations than private funding
- Strategic benefits: Spread risk across thousands of shareholders instead of few large investors, increase brand visibility and customer trust
- Stakeholder liquidity: Early investors (VCs, PE funds) get exit opportunity, employees can monetize ESOPs
- Growth currency: Use shares for acquisitions and expansion
The IPO Process
- Step 1 - Hiring Merchant Bankers:
- Companies appoint Book Running Lead Managers (BRLM) like Goldman Sachs, Kotak, ICICI Securities
- These bankers handle due diligence, documentation, pricing, and marketing
- Large IPOs may have multiple lead managers
- Step 2 - Regulatory Filing:
- Submit registration statement to SEBI
- Prepare Draft Red Herring Prospectus (DRHP) containing business model, 3-year financials, risk factors, use of proceeds, management details
- Wait for SEBI approval before proceeding
- Step 3 - Marketing Phase:
- Conduct roadshows where management presents to institutional investors
- Launch media campaigns in newspapers, TV, digital platforms
- Generate analyst coverage and research reports
- Step 4 - Price Discovery:
- Set price band (e.g., ₹100-120 per share)
- Open book building process where investors bid within range
- Determine cut-off price based on demand
- Step 5 - Subscription & Allotment:
- Keep bidding window open for 3-5 days
- Collect bids through brokers and banking apps
- Allocate shares via lottery in oversubscribed issues
- Return unallotted money within 6 days
- Step 6 - Listing Day:
- Shares begin trading on NSE/BSE
- Listing price determined by market demand-supply
- Can list at premium, par, or discount to issue price
IPO Pricing Explained
- Key Price Points:
- Face Value: Nominal value (₹1, ₹2, ₹5, or ₹10)
- Issue Price: Face value + Premium charged by company
- Price Band: Range for bidding (lower and upper price)
- Cut-off Price: Final issue price after book building
- Listing Price: First traded price on exchange
- Example Calculation:
Face Value: ₹10 Price Band: ₹485-500 Your Bid: ₹500 (cut-off) Final Issue Price: ₹498 Listing Price: ₹547 Your Gain: ₹49 per share (9.8%) - Grey Market Premium (GMP): Unofficial premium in unlisted market, indicates expected listing gains but can be manipulated
Share Allocation Rules
- Investor Categories & Reservation:
- Retail (RII): 35% reserved for applications up to ₹2 lakhs
- Non-Institutional (NII): 15% for applications above ₹2 lakhs
- Institutional (QIB): 50% for mutual funds, insurance companies, banks
- Oversubscription Impact:
- 2x oversubscribed: Proportionate allotment (get half of applied quantity)
- 10x+ oversubscribed: Lottery system for minimum lot
- Under-subscribed: Full allotment guaranteed
- Primary vs Secondary Market:
- Primary: IPO subscription period, fixed price, money goes to company
- Secondary: Post-listing exchange trading, fluctuating prices, investors trade among themselves
Critical IPO Terms
- Issue Types:
- Fresh Issue: New shares created, funds go to company
- Offer for Sale (OFS): Existing shareholders selling, funds go to them
- Mixed: Combination of both fresh and OFS
- Special Features:
- Green Shoe Option: 15% extra shares can be issued if oversubscribed
- Anchor Investors: Large institutions investing before public opening
- ASBA: Application Supported by Blocked Amount - money blocked, not debited
- Lock-in Period: Promoters can’t sell for 3 years, anchors for 30-90 days
- Application Process:
- Apply at cut-off to maximize allotment chances
- Use UPI for amounts up to ₹5 lakhs
- Multiple applications allowed using different PAN cards
- Avoid last-day rush due to technical glitches
Red Flags & Investment Strategy
- Warning Signs:
- Company using IPO funds primarily for debt repayment
- Negative cash flows with no profitability roadmap
- Valuations significantly higher than industry peers
- High OFS component indicating existing investors exiting
- Complex corporate structures or high related-party transactions
- For Listing Gains:
- Monitor GMP trends but don’t rely solely on them
- Check QIB subscription as institutional interest indicator
- Smaller issues often give higher listing pops
- Have clear exit strategy on listing day
- For Long-term Holdings:
- Study DRHP thoroughly, especially risk factors
- Compare valuations with listed competitors
- Understand revenue model and growth drivers
- Research promoter background and execution track record
Reality Check
- Performance Statistics: Only 50-60% of IPOs deliver positive listing gains. First-month post-listing typically volatile. Sector timing often matters more than company quality. Hyped IPOs don’t always make best long-term investments.
- Common Investor Mistakes: FOMO-driven applications without research. Over-allocating portfolio to IPO investments. Ignoring fundamentals while chasing listing gains. Depending entirely on grey market premiums.
- Portfolio Perspective: Treat IPOs as portfolio diversification tool, not core strategy. Best companies often list at fair valuations and grow steadily.
Investment Instruments
Traditional Banking Products
Fixed Deposits (FDs)
Fixed Deposits represent the foundation of conservative investing in India. When you invest in an FD, you’re essentially lending money to a bank for a predetermined period at a guaranteed interest rate. Think of it as a promise from the bank - they guarantee to return your principal plus interest after the agreed timeframe.
Key Features:
- Guaranteed Returns: Interest rates typically range from 4-7% annually, depending on the bank and tenure
- Safety: Deposits up to ₹5 lakh are insured by the Deposit Insurance and Credit Guarantee Corporation (DICGC)
- Flexible Tenure: Options ranging from 7 days to 10 years
- Tax Implications: Interest earned is taxable as per your income tax slab
When to Choose FDs: FDs work best for emergency funds, short-term goals (1-3 years), or when you need absolute capital protection. They’re ideal for risk-averse investors who prioritize safety over returns.
Example: If you invest ₹1 lakh in a 1-year FD at 6% interest, you’ll receive ₹1,06,000 after maturity, with ₹6,000 as taxable interest income.
Recurring Deposits (RDs)
Recurring Deposits encourage disciplined saving by requiring you to invest a fixed amount monthly. They’re perfect for building the habit of regular investing while earning slightly better returns than savings accounts.
Mechanism: You commit to depositing a fixed amount every month for a predetermined period. The bank compounds the interest on your accumulated deposits.
Example: Monthly deposit of ₹1,000 for 12 months at 5.5% interest yields approximately ₹12,330 at maturity - your ₹12,000 investment plus ₹330 in interest.
Returns: Typically 3-5% annually, making them suitable for short-term goals and emergency fund building.
Strategic Use: RDs serve as excellent stepping stones to more sophisticated investments like SIPs (Systematic Investment Plans) in mutual funds, helping you develop consistent investment discipline.
Mutual Funds: Professional Money Management
Mutual funds pool money from multiple investors to create diversified portfolios managed by professional fund managers.
Direct Plans: Purchased directly from the fund house, typically through their website or app. These have lower expense ratios as they don’t include distributor commissions, resulting in higher returns over time, hence better choose them.
Regular Plans: Purchased through intermediaries like brokers or financial advisors. While they have higher expense ratios due to commission payments, they may provide valuable advisory services.
Equity Mutual Funds
These funds invest primarily in stocks, offering potential for higher returns but with increased volatility. They’re suitable for long-term wealth creation and beating inflation over time.
Types and Applications:
- Large Cap Funds: Invest in established companies with market capitalization above ₹20,000 crores. They offer stability with moderate growth potential
- Mid Cap Funds: Focus on companies with market cap between ₹5,000-20,000 crores, balancing growth potential with higher risk
- Small Cap Funds: Target companies below ₹5,000 crores market cap, offering highest growth potential but with significant volatility
- Multi-Cap Funds: Provide diversification across all market segments, giving fund managers flexibility to adjust allocations based on market conditions
Tax Efficiency: Equity mutual funds held for more than one year qualify for Long Term Capital Gains (LTCG) tax.
Debt Mutual Funds
Debt funds invest in fixed-income securities like government bonds, corporate bonds, and money market instruments. They’re ideal for investors seeking regular income with lower risk than equity funds.
Categories by Duration:
- Liquid Funds: Invest in instruments with maturity up to 91 days, perfect for parking emergency funds with returns of 4-6%
- Short Duration Funds: Target securities with 1-3 years maturity, suitable for short-term goals
- Medium to Long Duration Funds: Invest in longer-term bonds, potentially offering higher returns but with interest rate risk
Understanding Interest Rate Risk: When interest rates rise, bond prices fall, affecting your fund’s value. Longer-duration funds are more sensitive to interest rate changes. The inverse relationship between interest rates and bond prices exists because of how bonds work. When you buy a bond, you’re essentially lending money to the issuer (like a government or corporation) in exchange for regular interest payments at a fixed rate. For example, imagine you buy a $1,000 bond that pays 3% annually. You’ll receive $30 per year until the bond matures. Now, here’s where interest rate risk comes in. If market interest rates rise to 5%, newly issued bonds will offer this higher rate. Your existing 3% bond suddenly becomes less attractive because investors could buy new bonds paying 5% instead. To compensate for this disadvantage, your bond’s price must fall in the secondary market. Someone would only buy your 3% bond if they could get it at a discount that makes its overall return competitive with the new 5% bonds. The opposite happens when rates fall. If new bonds only pay 2%, your 3% bond becomes more valuable, and its price rises. This price movement affects bond funds directly because they hold many bonds and must mark their portfolio to market daily. When rates rise, the value of all the bonds in the fund falls, reducing the fund’s net asset value (NAV). You experience this as a loss in your fund’s value, even though you haven’t sold anything. Duration measures how sensitive a bond or bond fund is to interest rate changes. It’s expressed in years and roughly tells you how much the bond’s price will change for each 1% change in interest rates. A bond fund with a duration of 5 years would lose approximately 5% of its value if interest rates rose by 1%. Conversely, it would gain about 5% if rates fell by 1%. Longer-duration funds are more sensitive because they typically hold bonds with longer maturities or lower coupon rates. The further into the future a bond’s cash flows extend, the more those future payments are affected by changes in discount rates (interest rates). Think of it this way: a 30-year bond has payments stretching three decades into the future, while a 2-year bond will return your principal relatively soon. The 30-year bond’s price must adjust much more dramatically to remain competitive when rates change. This sensitivity isn’t necessarily bad—it’s simply a characteristic to understand. In falling rate environments, longer-duration funds can provide substantial gains. However, in rising rate environments, they can experience significant losses.
Tax-Saving Mutual Funds (ELSS)
Equity Linked Savings Scheme (ELSS) funds offer the dual benefit of tax savings and wealth creation. They invest predominantly in equity markets while providing tax deductions under Section 80C.
Unique Advantages:
- Tax Deduction: Up to ₹1.5 lakh annual investment qualifies for tax deduction
- Shortest Lock-in: Only 3-year lock-in period among all Section 80C options
- Wealth Creation Potential: Historical returns of 12-15% annually over long periods
- Tax-Efficient Returns: Qualified for LTCG tax treatment after 3 years
Strategic Insight: ELSS funds can serve as your primary equity exposure while simultaneously reducing your tax burden, making them excellent for young professionals in higher tax brackets.
Index Funds and ETFs
Index funds and Exchange Traded Funds (ETFs) track specific market indices, offering broad market exposure at low costs. They represent a passive investment approach, eliminating the need to pick individual stocks or fund managers.
Benefits of Index Investing:
- Low Expense Ratios: Typically 0.1-0.8% compared to 1-2% for actively managed funds
- Broad Diversification: Instant exposure to top companies in an index
- Transparency: You always know exactly what you own
- Consistent Performance: Eliminates manager risk and style drift
ETF Considerations:
- Tracking Error: ETFs may not perfectly track their underlying index due to fees and operational factors
- Liquidity: Can be bought and sold during market hours like stocks
- Minimum Investment: Can start with as little as one unit
Popular ETFs: BeES (Benchmark Exchange Traded Scheme), Nifty ETFs, and sector-specific ETFs.
ETF vs. Index Funds: ETFs trade like stocks on exchanges, allowing intraday buying and selling, while index funds can only be bought/sold at end-of-day prices. Choose ETFs for flexibility and index funds for systematic investing.
International Mutual Funds
These funds invest in global markets, providing geographical diversification and exposure to developed economies. They’re particularly valuable for hedging against domestic market risks and currency fluctuations.
Popular Options:
- US Market Funds: Invest in S&P 500 or broader US indices
- Global Funds: Diversify across multiple countries and regions
- Emerging Market Funds: Focus on developing economies with higher growth potential
Tax Considerations: International funds are taxed as capital gains - gains held for less than 3 years are taxed as per your income slab, while gains beyond 3 years are taxed at 20% with indexation benefits.
Government-Backed Investment Options
Public Provident Fund (PPF)
PPF represents one of India’s most attractive long-term investment options, combining tax benefits with decent returns and complete safety. It’s designed to encourage long-term savings for retirement.
Triple Tax Benefit (EEE):
- Exempt: Investments up to ₹1.5 lakh qualify for tax deduction
- Exempt: No tax on annual interest earned
- Exempt: Maturity amount is completely tax-free
Strategic Features:
- 15-Year Commitment: Minimum tenure builds long-term discipline
- Flexible Contributions: ₹500 minimum to ₹1.5 lakh maximum annually
- Loan Facility: Available from 7th year onwards
- Partial Withdrawal: Allowed from 7th year for specific purposes
Power of Compounding Example: Monthly investment of ₹12,500 (₹1.5 lakh annually) at 7.1% for 15 years grows to approximately ₹40 lakh, with ₹17.5 lakh as tax-free interest.
National Savings Certificate (NSC)
NSC offers a government-guaranteed investment option with a 5-year lock-in period. It’s particularly suitable for conservative investors seeking tax benefits with assured returns.
Features:
- Current Interest Rate: Approximately 6.8% annually (subject to change)
- Tax Benefits: Qualifies for Section 80C deduction
- Automatic Reinvestment: Interest compounds annually
- Transferability: Can be transferred from one person to another
Sukanya Samriddhi Yojana (SSY)
This scheme promotes financial security for girl children through attractive interest rates and comprehensive tax benefits. It’s designed to support education and marriage expenses.
Eligibility and Benefits:
- Age Limit: Girl child aged 0-10 years
- Investment Range: ₹250 minimum to ₹1.5 lakh maximum annually
- Attractive Returns: Currently offering around 7.6% annual interest
- Long-term Maturity: 21 years from account opening
- Partial Withdrawal: Allowed for higher education expenses
Strategic Advantage: SSY currently offers one of the highest government-guaranteed returns available to retail investors, making it an excellent choice for parents planning their daughter’s future.
Government Welfare Schemes
Pradhan Mantri Jeevan Jyoti Bima Yojana (PMJJBY)
A pure term life insurance scheme offering affordable life coverage for low-income families.
Features:
- Coverage: ₹2 lakh life insurance
- Premium: ₹330 per annum
- Age Limit: 18-50 years for entry, coverage up to 55 years
- Tax Benefits: Premiums qualify for tax deduction
- Renewal: Annual renewal required
Pradhan Mantri Suraksha Bima Yojana (PMSBY)
An accident insurance scheme providing affordable coverage against accidental death and disability.
Coverage Details:
- Accidental Death: ₹2 lakh
- Permanent Total Disability: ₹2 lakh
- Permanent Partial Disability: ₹1 lakh
- Premium: ₹20 per annum
- Age Limit: 18-70 years
- Auto-debit: Premium deducted from linked bank account
Pradhan Mantri Awas Yojana (PMAY)
A housing scheme providing interest subsidies for home loans to economically weaker sections.
Eligibility and Benefits:
- Income Limits: Family income up to ₹18 lakh per annum
- Interest Subsidy: 4% to 6.5% depending on income category
- Loan Amount: Subsidies applicable on loan amounts up to ₹9-12 lakh
- Property Value: Varies by city category
Example: A Middle Income Group (MIG-I) buyer with income ₹12 lakh annually buying a ₹50 lakh house gets 4% interest subsidy on ₹9 lakh of the loan amount, with maximum subsidy of ₹2.35 lakh.
Pradhan Mantri Vaya Vandana Yojana (PMVVY)
An immediate annuity scheme for senior citizens providing guaranteed pension for life.
Features:
- Age Limit: 60 years and above
- Pension Options: Monthly, quarterly, half-yearly, or annual pension
- Guaranteed Returns: Currently around 7.4% annually
- Purchase Price: ₹1.5 lakh to ₹15 lakh
- Pension Period: For life of the pensioner
Insurance as an Investment Tool
Understanding insurance requires recognizing its dual nature - protection and investment. While insurance’s primary purpose is risk mitigation, certain products can serve investment goals when chosen wisely.
| Aspect | Term Insurance | Health Insurance | Life Insurance (Traditional / ULIPs) |
|---|---|---|---|
| Purpose | Pure life cover – pays nominee if the insured dies during the policy term | Covers medical expenses and hospitalization | Combines life cover with investment/savings component |
| Coverage | High death benefit (e.g., ₹1 crore) | Hospitalization & treatment costs up to sum insured | Lower life cover + maturity benefit |
| Policy Duration | 10–45 years | 1–3 years (renewable) | 5–30 years |
| Premium Cost | ₹10,000–25,000/year for ₹1 crore cover (age-dependent) | Varies with age, sum insured, and pre-existing conditions | Higher than term plans due to investment component |
| Death Benefit | Full sum assured if death occurs during the term | Not applicable | Life cover + fund value (for ULIPs) or bonus (for traditional plans) |
| Maturity Benefit | None (no return if you survive) | None | Maturity value (returns often 4–6% annualized) |
| Key Benefits | • High coverage at low cost • Financial security for family • Covers liabilities • Tax benefits (Sec 80C) |
• Protection from rising medical costs • Cashless hospitalization • Critical illness cover • Tax benefits (Sec 80D) |
• Enforced savings • Life cover + maturity benefit • Tax benefits (Sec 80C / 10(10D)) |
| Ideal Coverage | 10–15× your annual income | ₹5–10 lakh (individual/family floater) | Often insufficient as standalone life cover |
| Why Choose | Most cost-effective way to protect dependents financially | Healthcare inflation is ~10–15% annually | Only if you seek bundled insurance + disciplined savings |
| Why Be Cautious | N/A | N/A | • High charges (2–3%+ annually) • Complex and less transparent • Lower returns vs. mutual funds • May not provide adequate cover |
| Better Strategy | Buy term insurance for life cover | Buy sufficient health insurance early | Buy term plan + invest separately (e.g., mutual funds) for better flexibility and returns |
Additional Insurance Features:
- MWP (Married Women’s Property Act): Protects insurance proceeds from creditors and family disputes
- Life Stage Benefit: Allows increasing coverage at life milestones
- Zero Depreciation Cover: For vehicle insurance, covers full replacement cost without depreciation
Retirement Planning Instruments
Employee Provident Fund (EPF)
EPF forms the foundation of retirement planning for salaried employees. Both employee and employer contribute, creating a substantial retirement corpus over time.
Contribution Structure:
- Employee Contribution: 12% of basic salary + DA
- Employer Contribution: 12% of basic salary + DA (3.67% to EPF, 8.33% to EPS)
- Tax Benefits: Contributions qualify for Section 80C deduction
- Tax-Free Maturity: Withdrawals after 5 years are tax-free
Compounding Power: EPF currently offers around 8.5% annual returns, compounded annually. A 25-year-old earning ₹50,000 basic salary can accumulate over ₹1.5 crore by retirement through EPF alone.
Employee Pension Scheme (EPS)
EPS is a government-backed pension scheme that works alongside EPF, providing monthly pension after retirement. It’s funded by employer contributions and government support (and not the employee).
Key Features:
| Feature | EPF | EPS |
|---|---|---|
| Employee Contribution | 12% | Nil |
| Employer Contribution | 3.67% | 8.33% |
| Deposit Limit | No predetermined limit | Maximum ₹1,250 per month |
| Age Limit for Withdrawal | Not required | 58 years for regular pension, 50 years for early pension |
| Interest Rate | Interest received is tax-exempt | No interest rate applied |
| Withdrawal of Funds | After 58 years or unemployment for 60+ days | Monthly pension after 58 years |
| Premature Withdrawal | Complete balance can be withdrawn | Amount based on years of service |
EPS Benefits:
- Regular Pension: Monthly pension from age 58 based on years of service and salary
- Early Pension: Available from age 50 with 10 years of service (reduced amount)
- Disability Pension: In case of permanent disability
- Family Pension: For spouse and children after member’s death
- Maximum Pensionable Salary: Currently capped at ₹15,000 per month
Calculation Example: An employee with 35 years of service and average salary of ₹15,000 can expect monthly pension of approximately ₹4,500-5,000.
Atal Pension Yojana (APY)
APY provides guaranteed pension for unorganized sector workers and those not covered by EPF/EPS. It’s a government-backed scheme ensuring basic income security in old age.
Pension Structure:
- Monthly Pension Options: ₹1,000 to ₹5,000 monthly pension
- Entry Age: 18-40 years
- Pension Age: 60 years
- Government Co-contribution: For eligible low-income subscribers
Example: A 25-year-old contributing ₹210 monthly will receive ₹5,000 monthly pension from age 60, with spouse pension and nominee benefits.
Alternative Investment Avenues
Bonds and Debentures
A bond and debenture both are debt instruments used for fund raising. Bonds are issued by the government & debentures by public companies to raise money. Hence bonds are low risk, low reward & debentures high risk, high reward (but it may depend). In simple words; When a company raises money to expand or grow business, they have different methods:
- First, sell their ownership in the form of stocks (but selling ownership continuously is an issue as promoters/key shareholders will lose value)
- Second, Taking a bank loan
- Lastly, Taking loan from public, which is issue of bonds/debentures. Combined bonds from multiple companies is a basically a debt mutual fund.
Government Bonds:
- Issued by: Central and state governments
- Risk Level: Lowest risk as backed by government
- Returns: Lower but guaranteed
- Taxation: Interest taxable as per income tax slab
Corporate Debentures:
- Issued by: Private companies
- Risk Level: Higher risk but potentially higher returns
- Credit Rating: Look for AA or AAA rated instruments
- Priority: Bond holders get priority over shareholders in case of liquidation
Investment Strategy: Focus on high-quality bonds (AA+ or AAA rated) for safety, or consider debt mutual funds for professional management and diversification.
Treasury Bills
Government-issued short-term securities with maturities of 91, 182, or 364 days. They’re considered the safest investment as they’re backed by the government.
How They Work:
- Purchase: Bought at discount to face value
- Maturity: Redeemed at full face value
- Returns: Difference between purchase price and face value
Example: A 91-day treasury bill with face value ₹120 might be available at ₹118.40. After 91 days, you receive ₹120, earning ₹1.60 as risk-free profit.
Sovereign Gold Bonds (SGBs)
SGBs provide exposure to gold prices without the hassles of physical gold storage. They’re issued by the government, ensuring complete safety. Though, as per latest news, they are stopped.
Advantages Over Physical Gold:
- Additional Interest: 2.5% annual interest over gold price appreciation
- No Storage Costs: Eliminates locker charges and insurance
- Tax Benefits: No capital gains tax if held to maturity
- Liquidity: Can be traded on exchanges or held till maturity
Investment Strategy: SGBs work best for long-term gold allocation, typically 5-10% of your portfolio for diversification.
Real Estate Investment Trusts (REITs)
REITs democratize real estate investing by allowing small investors to own shares in large commercial properties. They provide exposure to real estate without the challenges of direct property ownership.
How REITs Work:
- Professional Management: Experienced teams manage properties
- Regular Income: Mandated to distribute 90% of income as dividends
- Liquidity: Trade on stock exchanges like regular stocks
- Transparency: Regular reporting and regulated operations
Types of REITs:
- Office REITs: Invest in office buildings and business parks
- Retail REITs: Own shopping malls and retail properties
- Industrial REITs: Focus on warehouses and logistics facilities
Popular REITs: Embassy Office Parks REIT, Brookfield India Real Estate Trust, Mindspace Business Parks REIT.
Tax Implications: Dividends from REITs are taxable, and capital gains follow equity taxation rules.
Commodity Investments
Commodities provide inflation protection and portfolio diversification. They often perform well when traditional assets struggle.
Major Commodity Exchanges:
- Multi Commodity Exchange (MCX): Largest commodity exchange in India
- National Commodity and Derivatives Exchange (NCDEX): Focus on agricultural commodities
- Intercontinental Exchange (ICE): International commodity platform
- National Multi Commodity Exchange (NMCE): Regional commodity trading
Commodity Categories:
- Metals: Gold, silver, copper, aluminum, zinc
- Energy: Crude oil, natural gas, heating oil
- Agricultural: Wheat, rice, sugar, cotton, spices
- Industrial: Various industrial raw materials
Investment Methods:
- Physical Commodities: Direct ownership of gold, silver
- Commodity ETFs: Exchange-traded funds tracking commodity prices
- Commodity Futures: Leveraged trading in commodity contracts
- Commodity Mutual Funds: Professionally managed commodity portfolios
Real Estate Direct Investment
Key Considerations for Property Investment:
Approved Project Financial (APF) Number: Always verify this unique code before investing. It indicates: Builder’s financial credibility, Government clearances, Dispute-free property status, Faster home loan approval.
Pre-EMI Options: For under-construction properties, consider paying only interest during construction period:
- Advantage: Lower monthly outgo initially
- Disadvantage: Longer total tenure and no immediate tax benefits
- Suitable For: Those paying both rent and EMI simultaneously
Pradhan Mantri Awas Yojana Benefits: Leverage government subsidies for affordable housing to reduce effective interest rates.
Peer-to-Peer (P2P) Lending
P2P lending platforms connect borrowers directly with lenders, potentially offering higher returns than traditional fixed deposits.
How P2P Works:
- Platform Registration: Register with RBI-approved platforms
- Risk Assessment: Platforms evaluate borrower creditworthiness
- Diversification: Spread investments across multiple borrowers
- Regular Returns: Receive monthly payments including principal and interest
Expected Returns: 10-15% annually, significantly higher than FDs but with credit risk.
Risk Management: Never invest more than ₹50,000 per platform (regulatory limit) and diversify across multiple borrowers.
Chit Funds
A traditional savings-cum-loan scheme where contributors pool money monthly, with the total amount auctioned to the lowest bidder each month.
How It Works:
- Group Formation: Fixed number of contributors (e.g., 20 people)
- Monthly Contribution: Each pays fixed amount monthly
- Auction System: Lowest bidder wins the total pool
- Commission: 5% typically goes to organizer
- Surplus Distribution: Remaining amount distributed among non-winners
Example: 20 contributors paying ₹1,000 monthly for 12 months:
- Month 1: Pool = ₹20,000, Winner bids ₹17,000
- Commission: ₹1,000 to organizer
- Surplus: ₹2,000 distributed among 19 others (₹105 each)
- Net Contribution: Others pay only ₹895 in Month 1
Expected Returns: Around 8%, but higher risk due to potential defaults.
Risks: Organizer default, member defaults, and regulatory concerns.
Credit Cards as Financial Tools
Credit cards can be valuable financial instruments when used strategically for rewards and cash flow management.
Benefits of Strategic Credit Card Use:
- Rewards and Points: Earn points on purchases for travel, meals, and shopping
- Cash Flow Management: 45-50 days interest-free credit period
- Purchase Protection: Additional warranty and dispute resolution
- Travel Benefits: Lounge access, insurance coverage, and forex advantages
Credit Card Against Fixed Deposit:
- Secured Credit Cards: Backed by FD as collateral
- Credit Limit: 80-90% of FD amount
- Lower Fees: Reduced charges compared to regular cards
- Easy Approval: Guaranteed approval with FD backing
- FD Benefits: Linked FD continues earning interest
Golden Rules:
- NEVER withdraw cash: Attracts high interest rates immediately
- Pay full amount: Avoid interest charges by paying entire bill
- Use for planned expenses: Don’t overspend just because credit is available
Emerging Investment Opportunities
Cryptocurrency
Digital currencies represent a new asset class with potential for high returns but significant volatility. Indian regulations are evolving, requiring careful consideration.
Key Considerations:
- Regulatory Uncertainty: Tax and legal framework still developing
- High Volatility: Prices can fluctuate dramatically
- Limited Allocation: Consider maximum 5% of portfolio
- Tax Implications: Gains taxed at 30% plus surcharge
Fractional Investing
Technology platforms now allow small investors to buy fractions of expensive stocks, making diversification more accessible.
Benefits:
- Lower Entry Barriers: Own shares of expensive stocks with small amounts
- Better Diversification: Spread investments across more securities
- Systematic Building: Gradually build positions in quality companies
Smallcase Investing
Smallcases offer professionally designed portfolios around specific themes, strategies, or ideas. They provide a middle ground between individual stock picking and mutual fund investing.
Advantages:
- Thematic Exposure: Invest in specific trends or sectors
- Transparency: Know exactly which stocks you own
- Professional Research: Benefit from expert stock selection
- Flexibility: Can modify holdings based on your preferences
Successful investing requires balancing different asset classes based on your age, risk tolerance, and goals.
Technical Ratios and Metrics
Note that, while using these ratios, you have to take into account the company you are analyzing, its industry, and the current market conditions. Ratios can vary significantly across sectors, so always compare with industry averages. We’ll cover fundamental analysis ratios that help evaluate a company or financial instrument’s health, performance, etc. And after that we’ll cover technical analysis ratios (more inclined towards instruments like market stocks).
Stock Metrics
Valuation Ratios
- Price-to-Earnings (P/E) Ratio
- Definition: Indicates how much investors pay for $1 of company earnings.
- Formula:
P/E Ratio = Current Stock Price / Earnings Per Share (EPS) - Types:
- Trailing P/E: Based on past 12 months earnings (historical performance)
- Forward P/E: Based on projected next 12 months earnings (growth expectations)
- Interpretation:
- Industry Average: ~18-20
- Good Range (India): 20-25
- High P/E (>25): May indicate overvaluation or high growth expectations
- Low P/E (<15): May indicate undervaluation or market skepticism
- Always compare with industry P/E for context
- Price-to-Sales (P/S) Ratio
- Definition: Compares market capitalization to total revenue
- Formula:
P/S Ratio = Market Capitalization / Total Revenue - Interpretation:
- Technology/Non-cyclical: <0.75 (highly desirable)
- General stocks: 0.75-1.5 (good picks)
- Above 3: Considered risky
- Industry Average: 1-2
- Particularly useful for companies without profits yet
- Price-to-Book (P/B) Ratio
- Definition: Compares market value to book value of assets
- Formula:
P/B Ratio = Market Price per Share / Book Value per Share - Interpretation:
- Below 1: Potentially undervalued (especially in IT sector)
- Above 1: Investors expect future growth
- Industry Average: <2
- Most relevant for asset-heavy companies like banks and manufacturing
- PEG Ratio (Price/Earnings to Growth)
- Definition: P/E ratio adjusted for earnings growth rate
- Formula:
PEG = P/E Ratio / Annual EPS Growth Rate - Interpretation:
- Below 1: Potentially undervalued relative to growth
- 1-2: Fairly valued
- Above 2: Potentially overvalued
- Helps identify growth stocks at reasonable prices
- Enterprise Value to EBITDA (EV/EBITDA)
- Definition: Total company value compared to operating earnings
- Formula:
EV/EBITDA = Enterprise Value / EBITDA - Interpretation:
- Below 10: Generally attractive
- 10-15: Fair value
- Above 15: Potentially expensive
- Better than P/E for comparing companies with different capital structures
- EV: Enterprise Value = Enterprise Value (EV) represents the total economic value of a company, encompassing both its equity and debt, making it a more comprehensive valuation metric than just market capitalization. It essentially reflects the theoretical cost to acquire the entire company, including paying off its debts.
- Formula: EV = Market Cap + Total Debt - Cash and Cash Equivalents
- Cash and cash equivalents are subtracted from the Enterprise Value (EV) because they represent readily available funds that an acquirer would effectively inherit, reducing the net cost of acquiring the company. Essentially, the cash could be used to pay down existing debt or offset the purchase price, making the company less expensive to acquire.
- EBITDA: Earnings Before Interest, Taxes, Depreciation, and Amortization
- Formula: EBITDA = Operating Income + Depreciation + Amortization
Profitability Metrics
- Return on Equity (ROE)
- Definition: Measures profitability relative to shareholders’ equity
- Formula:
ROE = (Net Income / Shareholders' Equity) × 100 - Interpretation:
- Excellent: >25% (for some industries)
- Good: >15%
- Below 10%: May indicate poor capital efficiency
- Shows how effectively management uses investor capital
- Return on Capital Employed (ROCE)
- Definition: Assesses profitability relative to total capital employed
- Formula:
ROCE = (EBIT / Capital Employed) × 100 - Interpretation:
- Excellent: >20%
- Good: 15-20%
- Below 10%: Poor capital efficiency
- Compare only within same industry
- Return on Assets (ROA)
- Definition: Measures how efficiently assets generate profit
- Formula:
ROA = (Net Income / Total Assets) × 100 - Interpretation:
- Above 5%: Generally good
- Industry-specific: Banks (1-2%), Tech (10%+)
- Indicates asset utilization efficiency
- Profit Margins
- Definition: Percentage of revenue converted to profit at various stages
- Types:
- Gross Profit Margin:
(Gross Profit / Revenue) × 100 - Operating Profit Margin:
(Operating Profit / Revenue) × 100 - Net Profit Margin:
(Net Profit / Revenue) × 100
- Gross Profit Margin:
- Industry Benchmarks:
- Manufacturing: 2-5% net margin
- IT/Software: 18-20% net margin
- FMCG: 10-15% net margin
- Pharmaceuticals: 15-25% net margin
- Higher margins indicate pricing power and efficiency
- EBITDA and EBITDA Margin
- Definition: Earnings Before Interest, Taxes, Depreciation, and Amortization
- Formula:
EBITDA = Net Income + Interest + Taxes + Depreciation + AmortizationEBITDA Margin = (EBITDA / Revenue) × 100
- Interpretation:
- Good EBITDA Margin: >15% for most sectors
- Excellent: >20%
- Useful for comparing companies with different capital structures
- Cash Flow Margin
- Definition: Efficiency in converting sales to operating cash flow
- Formula:
Cash Flow Margin = (Operating Cash Flow / Net Sales) × 100 - Interpretation:
- Strong: >20%
- Good: 10-20%
- Weak: <10%
- Shows actual cash generation capability
Financial Health Indicators
- Debt-to-Equity (D/E) Ratio
- Definition: Measures financial leverage by comparing debt to equity
- Formula:
D/E Ratio = Total Debt / Shareholders' Equity - Interpretation:
- Conservative: <0.5
- Moderate: 0.5-1.5
- Aggressive: >2.0
- Industry context crucial (utilities vs. tech companies)
- Current Ratio
- Definition: Ability to pay short-term obligations with current assets
- Formula:
Current Ratio = Current Assets / Current Liabilities - Interpretation:
- Healthy: 1.2-2.0
- Below 1: Potential liquidity issues
- Above 3: May indicate inefficient asset use
- Basic liquidity indicator
- Quick Ratio (Acid Test)
- Definition: More stringent liquidity measure excluding inventory
- Formula:
Quick Ratio = (Current Assets - Inventory) / Current Liabilities - Interpretation:
- Good: >1.0
- Adequate: 0.7-1.0
- Concerning: <0.5
- Better for companies with slow-moving inventory
- Interest Coverage Ratio
- Definition: Ability to pay interest on outstanding debt
- Formula:
Interest Coverage = EBIT / Interest Expense - Interpretation:
- Safe: >3.0
- Adequate: 1.5-3.0
- Risky: <1.5
- Critical for leveraged companies
- Debt Service Coverage Ratio (DSCR)
- Definition: Ability to service debt including principal and interest
- Formula:
DSCR = Net Operating Income / Total Debt Service - Interpretation:
- Strong: >1.25
- Minimum acceptable: 1.0
- Below 1.0: Cannot cover debt obligations
- Important for lenders and credit analysis
Growth Metrics
- Compound Annual Growth Rate (CAGR)
- Definition: Smoothed annual growth rate over a specified period
- Formula:
CAGR = [(Ending Value/Beginning Value)^(1/n)] - 1 - Interpretation:
- Excellent: >15% over 5 years
- Good: 10-12% (especially for large-cap)
- Market average: 8-10%
- Use for revenue, profit, and other metrics
- Year-over-Year (YoY) Growth
- Definition: Percentage change compared to same period last year
- Formula:
YoY Growth = [(Current Period - Prior Period) / Prior Period] × 100 - Application Areas:
- Revenue growth
- Profit growth
- Volume growth
- Watch for consistency and quality of growth
- Quarter-over-Quarter (QoQ) Growth
- Definition: Sequential quarterly growth rate
- Formula:
QoQ Growth = [(Current Quarter - Previous Quarter) / Previous Quarter] × 100 - Considerations:
- Account for seasonality
- Look for trends over multiple quarters
- More volatile than annual metrics
Cash Flow Metrics
- Free Cash Flow (FCF)
- Definition: Cash available after capital expenditures
- Formula:
FCF = Operating Cash Flow - Capital Expenditures - Interpretation:
- Positive and growing FCF is ideal
- Negative FCF acceptable for growth companies
- Critical for dividends, buybacks, and acquisitions
- Operating Cash Flow to Net Income Ratio
- Definition: Quality of earnings indicator
- Formula:
Operating Cash Flow / Net Income - Interpretation:
- Healthy: >1.0
- Equal to 1: Earnings match cash generation
- Below 1: Potential accounting issues
- Higher ratio indicates better earnings quality
- Free Cash Flow Yield
- Definition: Free cash flow relative to market value
- Formula:
FCF Yield = Free Cash Flow / Market Capitalization - Interpretation:
- Attractive: >5%
- Fair: 3-5%
- Low: <3%
- Alternative to dividend yield
Ownership & Management Metrics
- Promoter Holding
- Definition: Percentage of shares held by company founders/promoters
- Interpretation:
- Strong signal: >50%
- Moderate: 35-50%
- Low: <25% (may indicate lack of confidence)
- Higher holding shows promoter confidence
- Pledged Promoter Holding
- Definition: Promoter shares used as collateral for loans
- Red Flags:
- High pledging: >50% of promoter holding
- Increasing trend: Deteriorating financial situation
- Zero pledging: Ideal scenario
- High pledging indicates financial stress
- Institutional Holding
- Definition: Percentage held by institutional investors
- Categories:
- FII (Foreign Institutional Investors)
- DII (Domestic Institutional Investors)
- Mutual Funds
- Interpretation:
- High institutional holding: >40% shows confidence
- Balanced FII/DII: Better stability
- Indicates professional validation
Efficiency Ratios
- Asset Turnover Ratio
- Definition: Revenue generated per rupee of assets
- Formula:
Asset Turnover = Revenue / Average Total Assets - Interpretation:
- High: Efficient asset utilization
- Industry-specific: Retail (high), Utilities (low)
- Compare within industry only
- Inventory Turnover Ratio
- Definition: How quickly inventory is sold
- Formula:
Inventory Turnover = Cost of Goods Sold / Average Inventory - Interpretation:
- High: Efficient inventory management
- Too high: May indicate stock shortages
- Low: Excess inventory or slow sales
- Critical for retail and manufacturing
- Receivables Turnover Ratio
- Definition: Efficiency in collecting credit sales
- Formula:
Receivables Turnover = Credit Sales / Average Receivables - Days Sales Outstanding:
365 / Receivables Turnover - Interpretation:
- Lower DSO: Better collection efficiency
- Industry norms: Vary significantly
- Important for working capital management
Mutual Fund Analysis
Performance Metrics
- Expense Ratio
- Definition: Annual fee charged for fund management
- Benchmarks:
- Index Funds: <0.5%
- Active Equity Funds: 0.5-0.75% (good)
- Above 1.5%: Considered high
- Direct vs Regular: Direct plans 0.5-1% lower
- Lower expense ratio means higher returns for investors
- Sharpe Ratio
- Definition: Risk-adjusted return measure
- Formula:
Sharpe Ratio = (Fund Return - Risk-Free Rate) / Standard Deviation - Interpretation:
- Excellent: >1.5
- Good: 1.0-1.5
- Average: 0.5-1.0
- Poor: <0.5
- Higher ratio indicates better risk-adjusted performance
- Alpha
- Definition: Excess return over benchmark
- Formula:
Alpha = Fund Return - (Risk-Free Rate + Beta × (Benchmark Return - Risk-Free Rate)) - Interpretation:
- Positive Alpha: Outperforming benchmark
- Zero Alpha: Matching benchmark
- Negative Alpha: Underperforming
- Measures fund manager’s value addition
- Beta
- Definition: Volatility relative to market/benchmark
- Interpretation:
- Beta = 1: Moves with market
- Beta > 1: More volatile than market
- Beta < 1: Less volatile than market
- Negative Beta: Inverse correlation
- Indicates systematic risk exposure
- Standard Deviation
- Definition: Measure of return volatility
- Risk Categories:
- Low Risk: <10%
- Moderate Risk: 10-20%
- High Risk: >20%
- Higher SD means more volatile returns
- Sortino Ratio
- Definition: Risk-adjusted return using only downside deviation
- Formula:
Sortino Ratio = (Return - Risk-Free Rate) / Downside Deviation - Advantage: Focuses only on harmful volatility
- Interpretation: Higher is better, similar scale to Sharpe
Risk Metrics
- Downside Capture Ratio
- Definition: Fund’s performance during market declines
- Formula:
(Fund's negative return / Benchmark's negative return) × 100 - Interpretation:
- Excellent: <80
- Good: 80-90
- Average: 90-100
- Poor: >100
- Lower ratio means better downside protection
- Upside Capture Ratio
- Definition: Fund’s performance during market rallies
- Formula:
(Fund's positive return / Benchmark's positive return) × 100 - Interpretation:
- Excellent: >110
- Good: 100-110
- Average: 90-100
- Higher ratio means better participation in rallies
- Maximum Drawdown
- Definition: Largest peak-to-trough decline
- Formula:
(Trough Value - Peak Value) / Peak Value × 100 - Interpretation:
- Shows worst-case scenario
- Compare with peers and benchmark
- Important for risk assessment
- Tracking Error
- Definition: Standard deviation of excess returns vs benchmark
- Formula:
Standard Deviation of (Fund Return - Benchmark Return) - For Index Funds:
- Excellent: <0.5%
- Good: 0.5-1%
- Poor: >2%
- Lower is better for passive funds
Portfolio Metrics
- Portfolio Turnover Ratio
- Definition: Frequency of portfolio changes
- Formula:
(Lesser of Purchases or Sales) / Average AUM × 100 - Interpretation:
- Low (<50%): Buy-and-hold strategy
- Moderate (50-100%): Balanced approach
- High (>100%): Active trading
- Higher turnover means higher transaction costs
- Asset Under Management (AUM)
- Size Categories:
- Very Large: >₹10,000 Cr
- Large: ₹5,000-10,000 Cr
- Medium: ₹1,000-5,000 Cr
- Small: <₹1,000 Cr
- Implications:
- Too large may face liquidity issues
- Too small may have higher expense ratios
- Optimal size depends on strategy
- Size Categories:
- Exit Load
- Definition: Fee for early redemption
- Typical Structure:
- 1% if redeemed within 12 months
- 0.5% if redeemed within 6 months
- Nil after specified period
- Lower exit load provides more flexibility
- Cash Holdings
- Definition: Percentage of portfolio in cash/equivalents
- Interpretation:
- Normal: 2-5%
- High (>10%): Defensive positioning
- Very Low (<2%): Fully invested
- Indicates fund manager’s market view
Insurance Sector Metrics
Life Insurance Metrics
- Claim Settlement Ratio (CSR)
- Definition: Percentage of claims settled vs. received.
- Formula:
CSR = (Claims Settled / Total Claims) × 100 - Benchmarks: Excellent: >95%, Good: 90–95%, Concerning: <90%
- Higher CSR indicates reliable insurer
- Claim Rejection Ratio
- Definition: Percentage of claims rejected.
- Benchmarks: Good: <2%, Acceptable: 2–5%, High: >5%
- Lower is better for policyholders
- Amount Settlement Ratio
- Definition: Percentage of claimed amount actually paid.
- Formula:
(Total Amount Paid / Total Amount Claimed) × 100 - Benchmarks: Excellent: >95%, Good: 90–95%, Poor: <90%
- Shows partial settlement practices
- Solvency Ratio
- Definition: Indicates an insurer’s ability to meet long-term liabilities.
- Regulatory Minimum: 1.5
- Benchmarks: Strong: >2.0, Adequate: 1.5–2.0, Concerning: Near 1.5
- Higher ratio indicates financial strength
- Persistency Ratio
- Definition: Measures how many policies are renewed over time.
- Time Frames: 13th month (1st year), 25th month (2nd year), 61st month (5th year)
- Good Persistency:
- 13th month: >80%
- 61st month: >50%
- Indicates customer satisfaction
- Incurred Claim Ratio (ICR)
- Definition: Claims paid as percentage of premiums
- Formula:
(Claims Incurred / Premiums Earned) × 100 - For Health Insurance: Optimal: 60-90%, Too Low (<50%): Overpriced policies, Too High (>100%): Unsustainable
- Balance between value and sustainability
Health Insurance Considerations
- Network Hospitals: Look for wide and accessible network. Pan India: 5000+ hospitals preferred & 500+ hospitals in tier 1 city.
- Pre-existing Disease Waiting Period: Standard Periods: General: 2-4 years, Specific Conditions: May vary.
- Pre/Post Hospitalization: Minimum 30 days before and 60 days after
- Day Care Procedures: Should cover treatments requiring <24 hrs admission
- No Claim Bonus (NCB): Typically 10–50% increase in coverage for claim-free years
- Co-payment Clause: Lower % is better for policyholder
- Room Rent Limits: Preferably no sub-limits (flexibility in hospital choice)
- Incurred Claim Ratio (ICR): Balanced range: 60–90%
- Complaint Volume: Check IRDAI annual report or website
- Cashless Claim Settlement Time: Ideal: Less than 2 hours. Faster settlement reduces financial stress
Technical Analysis for Trading
Trend Indicators
- Moving Averages
- Definition: Price averages over specific periods to identify trends
- Types:
- Simple Moving Average (SMA): Equal weight to all prices in period
- Exponential Moving Average (EMA): More weight to recent prices, faster response
- Weighted Moving Average (WMA): Linear weight distribution favoring recent data
- Displaced Moving Average (DMA): MA shifted forward/backward in time
- Double Exponential Moving Average (DEMA): Reduced lag for faster signals
- Key Periods:
- 20 DMA: Short-term trend (approximately 1 month)
- 50 DMA: Medium-term trend (approximately 2.5 months)
- 200 DMA: Long-term trend (approximately 200 trading days/year)
- Trading Signals:
- Price above MA: Uptrend confirmation
- Price below MA: Downtrend confirmation
- Golden Cross: 50 DMA crosses above 200 DMA (bullish)
- Death Cross: 50 DMA crosses below 200 DMA (bearish)
- Best used in trending markets, less effective in sideways markets
- MACD (Moving Average Convergence Divergence)
- Definition: Momentum indicator showing relationship between two moving averages
- Components:
- MACD Line: 12-period EMA minus 26-period EMA
- Signal Line: 9-period EMA of MACD line
- Histogram: MACD line minus Signal line (visualizes convergence/divergence)
- Trading Signals:
- MACD crosses above signal line: Bullish momentum
- MACD crosses below signal line: Bearish momentum
- Zero line crossovers: Trend confirmation (above = bullish, below = bearish)
- Divergences: Price makes new high/low but MACD doesn’t (reversal signal)
- Most effective in trending markets, prone to whipsaws in ranging markets
- Average Directional Index (ADX)
- Definition: Measures trend strength without indicating direction
- Range: 0-100 scale
- Interpretation:
- Above 25: Strong trend present
- 20-25: Developing trend
- Below 20: Weak or no trend (ranging market)
- Above 40: Very strong trend
- Often combined with +DI and -DI lines for direction
- Does not indicate trend direction, only strength
- Support and Resistance Levels
- Support: Price level where buying interest prevents further decline
- Acts as price floor
- Previous resistance becomes support when broken
- Stronger with multiple touches
- Resistance: Price level where selling pressure prevents further rise
- Acts as price ceiling
- Previous support becomes resistance when broken
- Volume confirms strength of levels
- Trading Strategies:
- Buy near support with stop below
- Sell near resistance with stop above
- Trade breakouts when levels are decisively broken
- Look for role reversal (support becoming resistance and vice versa)
Basic Support and Resistance Concept:

  Price
    ↑
    │   RESISTANCE ZONE ═══════════════════════════════ Sellers Dominate
    │                      ┌─┐ ╱╲    ┌─┐
    │                   ╱╲ │ │╱  ╲ ╱╲│ │
    │                 ╱╲╱ ╲│ │    ╲╱ ╲│ │
    │               ╱╲╱    └─┘        └─┘
    │             ╱╲╱    Selling Pressure
    │           ╱╲╱      Prevents Rise
    │      ╱╲ ╱
    │    ╱╲╱ ╲╱                              Price
    │  ╱╲╱                                   Action
    │╱╲╱
    │        ┌─┐                    ┌─┐
    │      ╱╲│ │                  ╱╲│ │
    │    ╱╲╱ ╲│ │  ╱╲    ╱╲    ╱╲╱ ╲│ │
    │  ╱╲╱    └─┘╱╲╱ ╲╱╲╱  ╲╱╲╱    └─┘
    │   Buying Interest  Prevents Fall
    │   SUPPORT ZONE ═══════════════════════════════ Buyers Dominate
    │
    └────────────────────────────────────────────→ Time
Multiple Touches Strengthen Levels: Resistance Getting Stronger With Each Test: Price ↑ 1st Touch 2nd Touch 3rd Touch 4th Touch │ ╱╲ ╱╲ ╱╲ ╱╲ │ ╱╲╱ ╲ ╱╲╱ ╲ ╱╲╱ ╲ ╱╲╱ ╲ ═════════════╱════╲══╱══════╲══╱══════╲═╱══════╲═══ RESISTANCE │ ╱╲╱ ╲╱ ╲╱ ╲╱ ╲ │ ╱╲╱ ╲ Eventually │╱╲╱ ╲ Breaks! │ ╲╱ └──────────────────────────────────────────────→ Time Each touch validates the level → More traders notice → Stronger levelRole Reversal in Action: Before Breakout: After Breakout: Resistance Old Resistance ↓ Now Support ↓ ════════│═══════ │ ╱╲ │ ╱╲ │ ╱╲ ╱╲╱ ╲ │ ╱╲╱ ╲ │ ╱╲╱ ╲╱╲ ╱ ╲╱─┴╱ ╲ ════│══╱══════╲═ Can't Break ╱╲ │ ╱ ╲╱ ╱╲╱ ╲ │╱ Successful ╱╲╱ ╲╱─┤ Retest Breakout │ ↑│ Now Acts as SupportBUY NEAR SUPPORT STRATEGY: Price ↑ │ ╱╲ SELL Zone │ ╱╲╱ ╲ (Take Profit) │ ╱╲╱ ╲ │ ╱╲╱ ╲╱ │ ╱╲╱ │ ╱╲╱ ← Entry Point │ ╱╲ ╱ (Buy Signal) │ ╱╲╱ ╲╱ ══════│═╱═════════════════════════ SUPPORT LEVEL │ │ X ← Stop Loss (Below Support) │ └────────────────────────→ Time Risk/Reward Setup: - Risk: Entry to Stop Loss - Reward: Entry to Resistance - Ideal Ratio: 1:2 or betterVALID BREAKOUT vs FALSE BREAKOUT: Valid Breakout (High Volume): False Breakout (Low Volume): │ ╱╲ │ ╱╲ Fails │ ╱╲╱ ╲ Continues │ ╱╲╱ ╲╱╲ │ ╱╲╱ ╲ Higher │╱╲╱ ╲ Returns ═════│═╱════════╲═════ ═══│═════════╲══════ │╱ ↑ ╲ │ ╲╱ │ │ ╲ │ │ └ Strong Volume │ Weak Volume │ Confirms Break │ No Follow-throughCOMPREHENSIVE LEVEL ANALYSIS: Price ↑ Zone of Distribution (Selling) │ ┌─────────────────┐ │ │▓▓▓▓▓▓▓▓▓▓▓▓▓▓▓▓│ Major Resistance $110 ├───┼─────────────────┼────────────────── │ └─────────────────┘ ╱╲ │ ╱╲╱ ╲ ╱╲ │ ╱╲ ╱╲╱ ╲╱╲╱ ╲ $105 ├──────╱──╲─────────╱──────────────╲──── Minor Resistance │ ╱╲╱ ╲ ╱╲╱ ╲ │ ╱╲╱ ╲╱╲╱ ╲╱ $100 ├╱─────────────────────────────────────── Pivot Level │ │ ┌─────────────────┐ $95 ├──┼─────────────────┼─────────────────── Minor Support │ │▓▓▓▓▓▓▓▓▓▓▓▓▓▓▓▓│ Zone of │ └─────────────────┘ Accumulation (Buying) │ └────────────────────────────────────→ Time Key Observations: • Wider zones = Stronger levels • Multiple timeframe confluence • Volume validates importanceMOVING AVERAGES AS DYNAMIC SUPPORT/RESISTANCE: Price ↑ Dynamic Resistance │ (50-day MA) │ ╱╲ ↓ │ ╱╲╱ ╲ ────┐────── │ ╱╲╱ ╲ ╱╲ │ ╲ │ ╱╲╱ ╲╱╲╱ ╲ │ ╲ │ ╱╲╱ ╲╱────┘ ╲ │╱ ╲ │ ╱──────────── ╲ │ ╱╲╱ ╲ ╲ │ ╱╲╱ ╲╱╲ │╱╲╱ ↑ ╲╱╲╱ │ │ │ Dynamic Support │ (200-day MA) └────────────────────────────────→ Time Static levels = Horizontal lines Dynamic levels = Moving with priceCOMPLETE TRADING SETUP: Price ↑ $120 │━━━━━━━━━━━━━━━━━━━━━━━━ Major Resistance (Monthly) │ $115 │─ ─ ─ ─ ─ ─ ─ ─ ─ ─ ─ ─ Weekly Resistance │ ╱╲ Target 2 │ ╱╲╱ ╲ ↑ $110 │- - - - - - - - - - - - - Daily Resistance │ ╱ ╲ Target 1 │ ╱ LONG ╲ ↑ $105 │╱ Entry ╲ │ Zone ╲ $102 │━━━━━━━━━━━━━━━━━━━━━━━━ Current Price Level │ $100 │═════════════════════════ Strong Support (Tested 4x) │ $98 │· · · · · · · · · · · · · Stop Loss Level │ $95 │─ ─ ─ ─ ─ ─ ─ ─ ─ ─ ─ ─ Next Support Level │ └────────────────────────→ Time Trade Management: 1. Entry: $102-103 (Near support) 2. Stop Loss: $98 (Below support) 3. Target 1: $110 (First resistance) 4. Target 2: $115 (Major resistance) 5. Risk/Reward: 1:2 minimum
- Support: Price level where buying interest prevents further decline
Momentum Indicators
- Relative Strength Index (RSI)
- Definition: Momentum oscillator measuring speed and magnitude of price changes
- Formula:
RSI = 100 - (100 / (1 + RS))where RS = Average Gain/Average Loss - Range: 0-100 bounded oscillator
- Standard Interpretation:
- Overbought: Above 70 (traditionally), above 60 (modern markets)
- Oversold: Below 30
- Neutral: 40-60 range
- Advanced Concepts:
- Bullish Divergence: Price makes lower low, RSI makes higher low
- Bearish Divergence: Price makes higher high, RSI makes lower high
- RSI Trendlines: Can draw support/resistance on RSI itself
- Works best in ranging markets, less reliable in strong trends
- Stochastic Oscillator
- Definition: Compares closing price to price range over specified period
- Components:
- %K Line: Fast stochastic (raw calculation)
- %D Line: Slow stochastic (3-period SMA of %K)
- Interpretation:
- Overbought: Above 80
- Oversold: Below 20
- Crossovers: %K crossing %D provides signals
- Types:
- Fast Stochastic: More sensitive, more signals
- Slow Stochastic: Smoothed version, fewer false signals
- Particularly useful for timing entries and exits in ranging markets
- Rate of Change (ROC)
- Definition: Percentage change in price over specified period
- Formula:
ROC = [(Current Price - Price n periods ago) / Price n periods ago] × 100 - Interpretation:
- Positive ROC: Upward momentum
- Negative ROC: Downward momentum
- Zero line crossovers: Momentum shifts
- Acts as leading indicator for potential trend changes
- Can identify overbought/oversold conditions at extremes
Volume Indicators
- On-Balance Volume (OBV)
- Definition: Cumulative volume indicator based on price direction
- Calculation:
- Add volume on days when close > previous close
- Subtract volume on days when close < previous close
- No change when close = previous close
- Interpretation:
- Rising OBV: Accumulation phase (bullish)
- Falling OBV: Distribution phase (bearish)
- OBV/Price divergence: Potential reversal signal
- Confirms price trends and identifies smart money flow
- Volume Weighted Average Price (VWAP)
- Definition: Average price weighted by volume throughout the day
- Formula:
VWAP = Σ(Price × Volume) / Σ Volume - Uses:
- Intraday support/resistance level
- Fair value benchmark for institutional traders
- Trade execution benchmark
- Trading Applications:
- Price above VWAP: Bullish intraday bias
- Price below VWAP: Bearish intraday bias
- Resets daily, primarily for intraday trading
- Accumulation/Distribution Line (A/D)
- Definition: Volume-based indicator measuring buying vs selling pressure
- Calculation: Uses close position within day’s range multiplied by volume
- Interpretation:
- Rising A/D with rising price: Bullish confirmation
- Falling A/D with rising price: Bearish divergence (distribution)
- Rising A/D with falling price: Bullish divergence (accumulation)
- More sophisticated than OBV as it considers price location within range
- Volume Profile
- Definition: Horizontal histogram showing volume traded at each price level
- Key Concepts:
- Point of Control (POC): Price with highest volume
- Value Area: Range containing 70% of volume
- High Volume Nodes: Strong support/resistance
- Low Volume Nodes: Potential breakout areas
- Trading Applications:
- Identify key support/resistance levels
- Find fair value areas
- Spot accumulation/distribution zones
Volatility Indicators
- Bollinger Bands
- Definition: Volatility bands placed above and below a moving average
- Components:
- Middle Band: 20-period SMA (default)
- Upper Band: Middle Band + (2 × Standard Deviation)
- Lower Band: Middle Band - (2 × Standard Deviation)
- Trading Signals:
- Price at upper band: Overbought condition
- Price at lower band: Oversold condition
- Band squeeze: Low volatility, potential breakout pending
- Band expansion: High volatility, trend continuation
- Advanced Concepts:
- Bollinger Squeeze: Bands narrow, volatility contraction
- Walking the Bands: Strong trend when price hugs one band
- Adapts automatically to market volatility
- Average True Range (ATR)
- Definition: Measures market volatility regardless of direction
- Calculation: Average of true ranges over specified period
- True Range: Greatest of:
- Current high minus current low
- Current high minus previous close
- Current low minus previous close
- Applications:
- Position sizing based on volatility
- Stop-loss placement (e.g., 2 × ATR)
- Volatility comparison between instruments
- Higher ATR indicates higher volatility and risk
- Implied Volatility (IV)
- Definition: Market’s expectation of future price volatility
- Source: Derived from options pricing models
- Key Concepts:
- IV Rank: Current IV relative to 52-week range
- IV Percentile: Percentage of days IV was lower
- Volatility Smile: IV pattern across strike prices
- Trading Applications:
- High IV: Market expecting large moves
- IV crush: Post-event volatility collapse
- Options pricing and strategy selection
Pattern Recognition
- Good videos around candlestick pattern & strategies:
- Candlestick Patterns
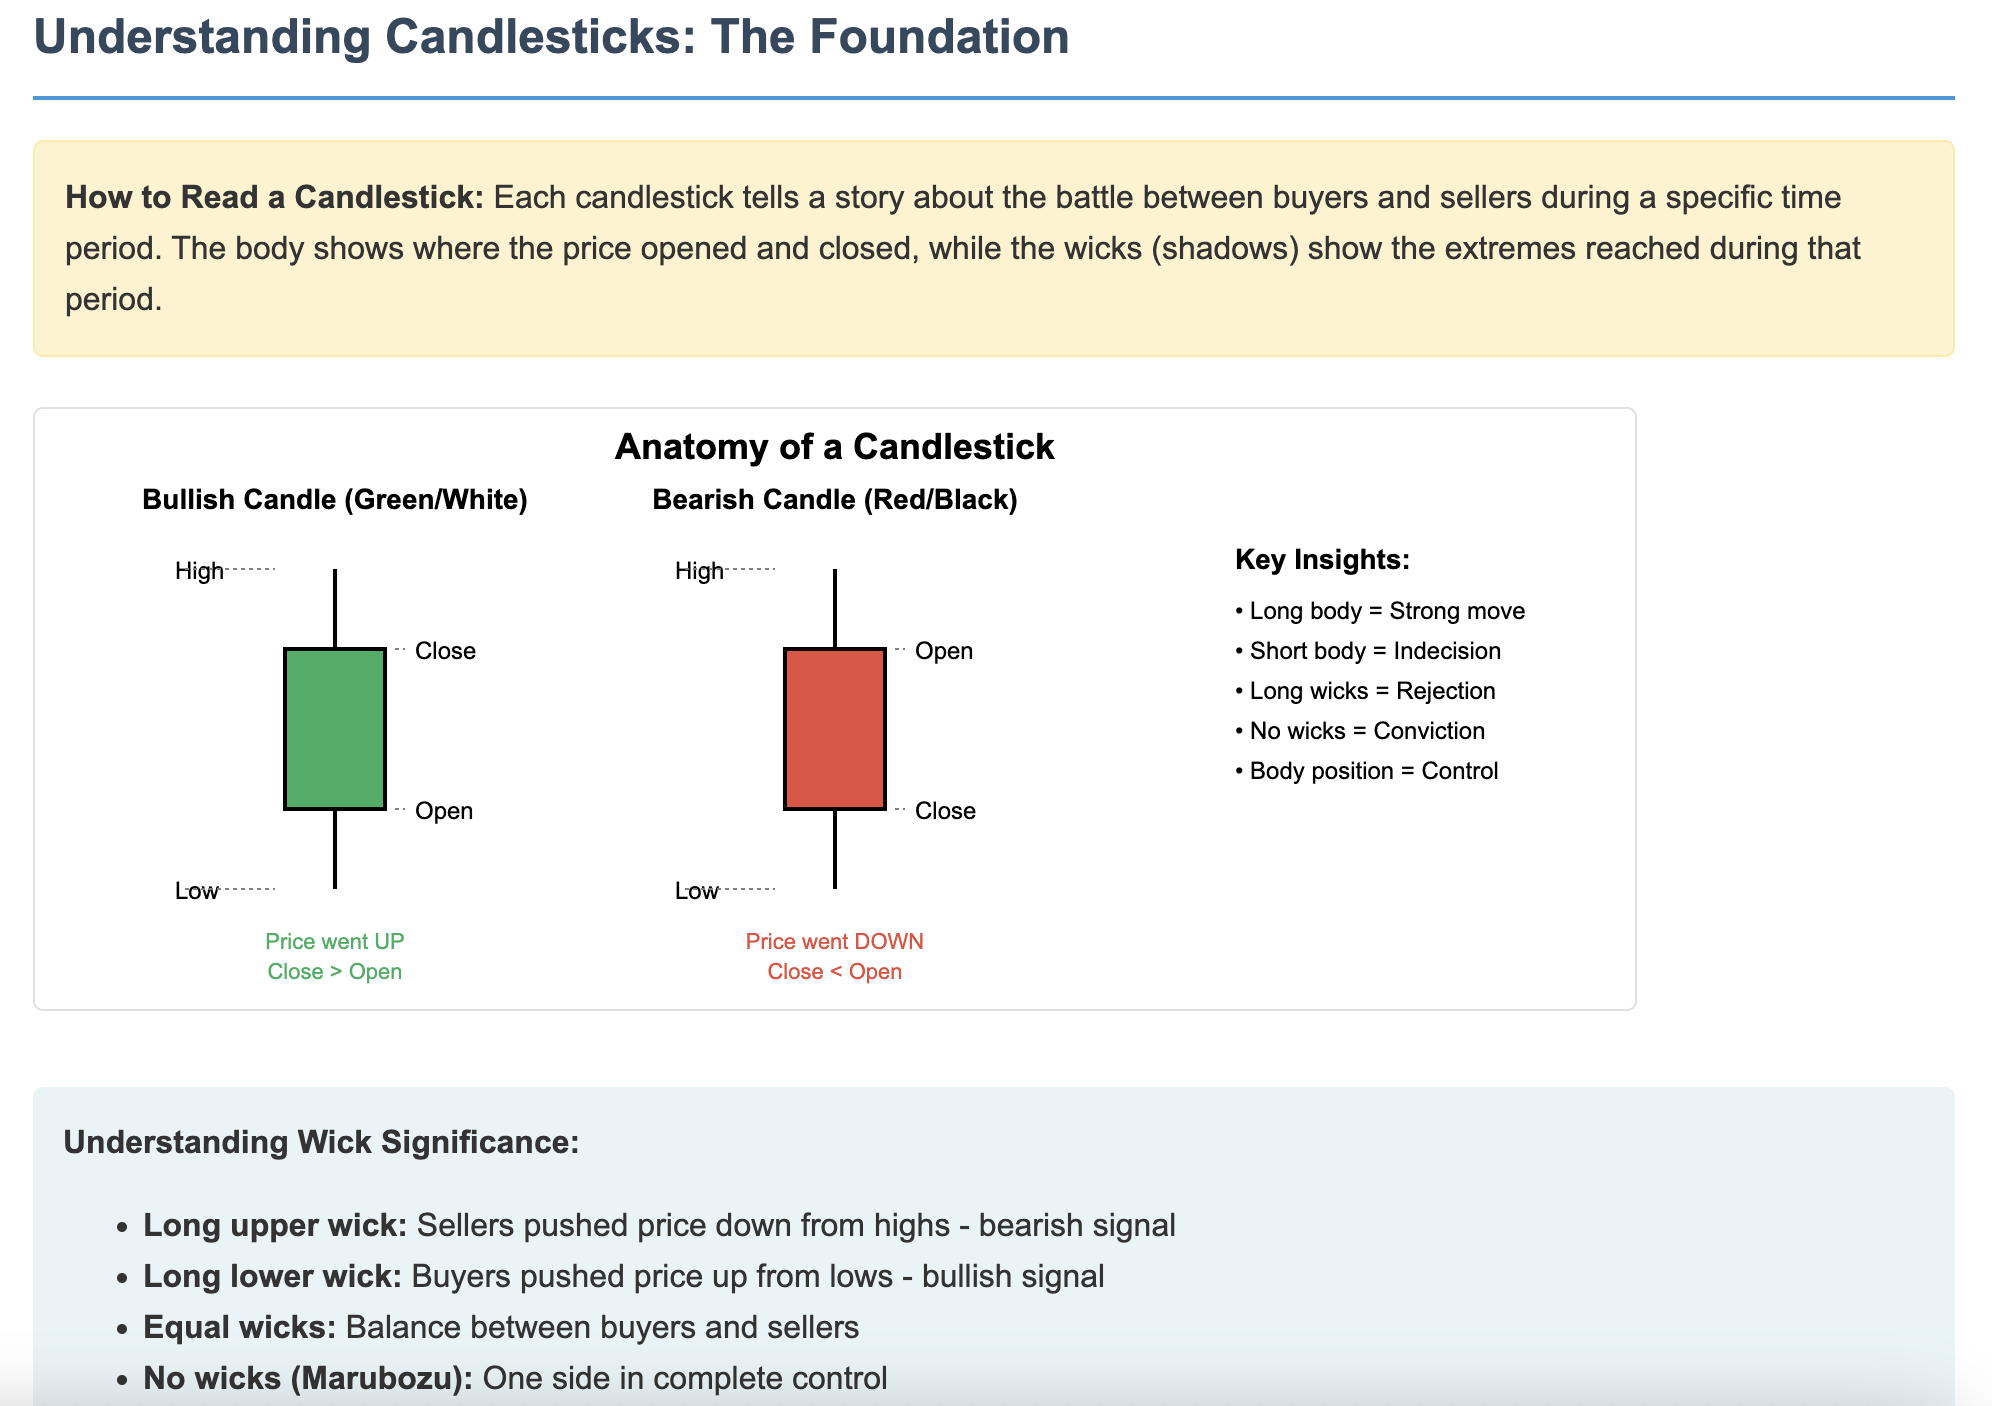
- Single Candle Patterns:
- Doji: Open equals close, indecision
- Hammer: Long lower wick, potential reversal
- Shooting Star: Long upper wick, bearish reversal
- Marubozu: No wicks, strong directional move
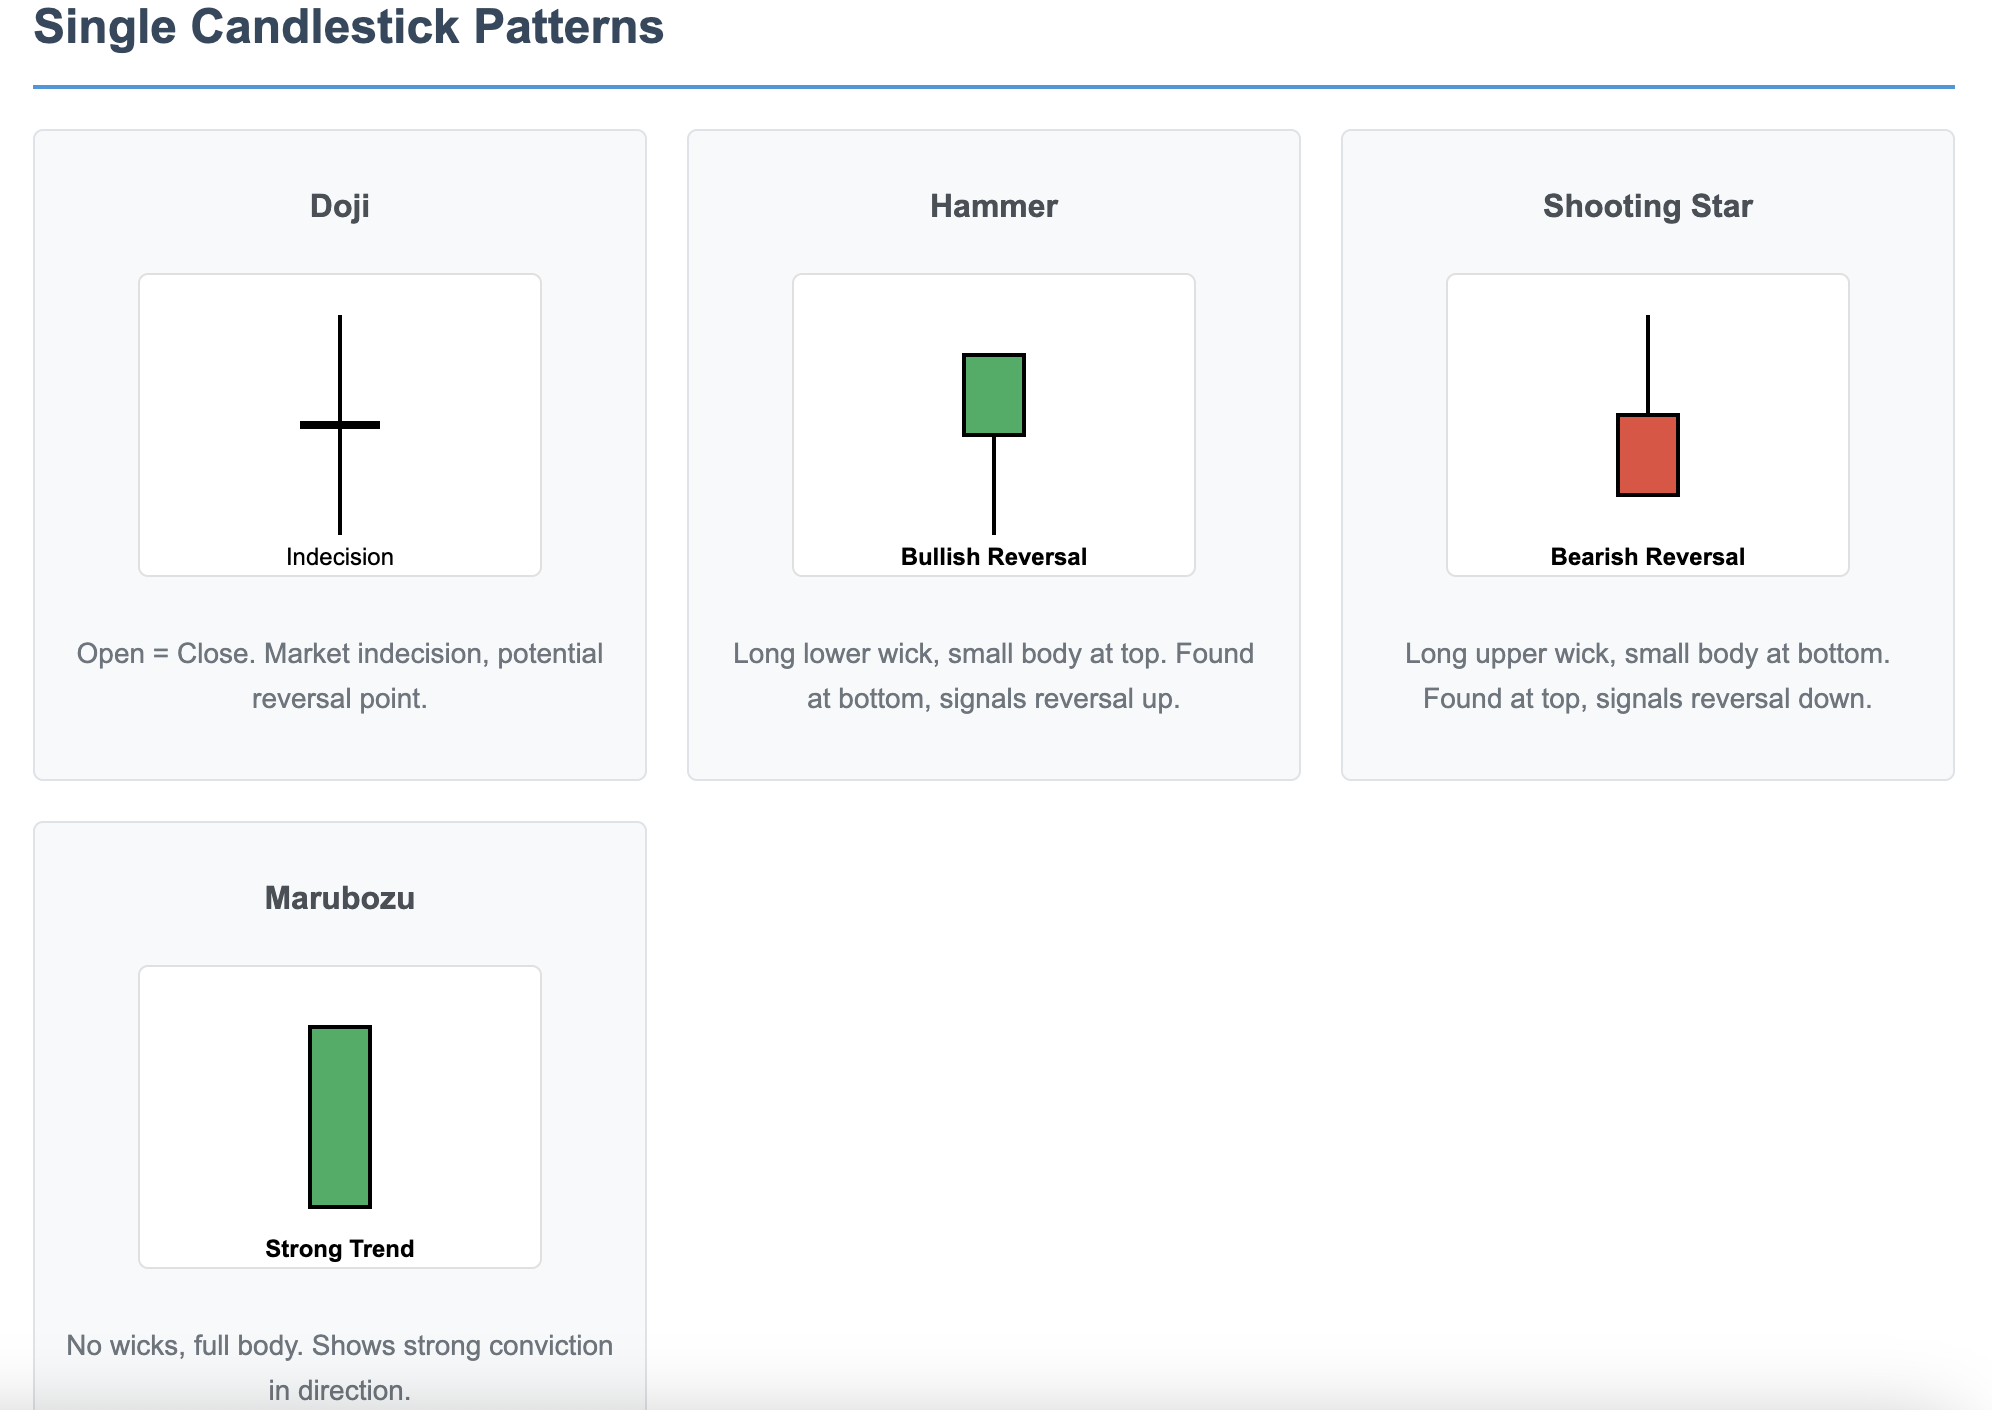
- Double Candle Patterns:
- Bullish Engulfing: Large green candle engulfs previous red
- Bearish Engulfing: Large red candle engulfs previous green
- Piercing Pattern: Bullish reversal pattern
- Dark Cloud Cover: Bearish reversal pattern
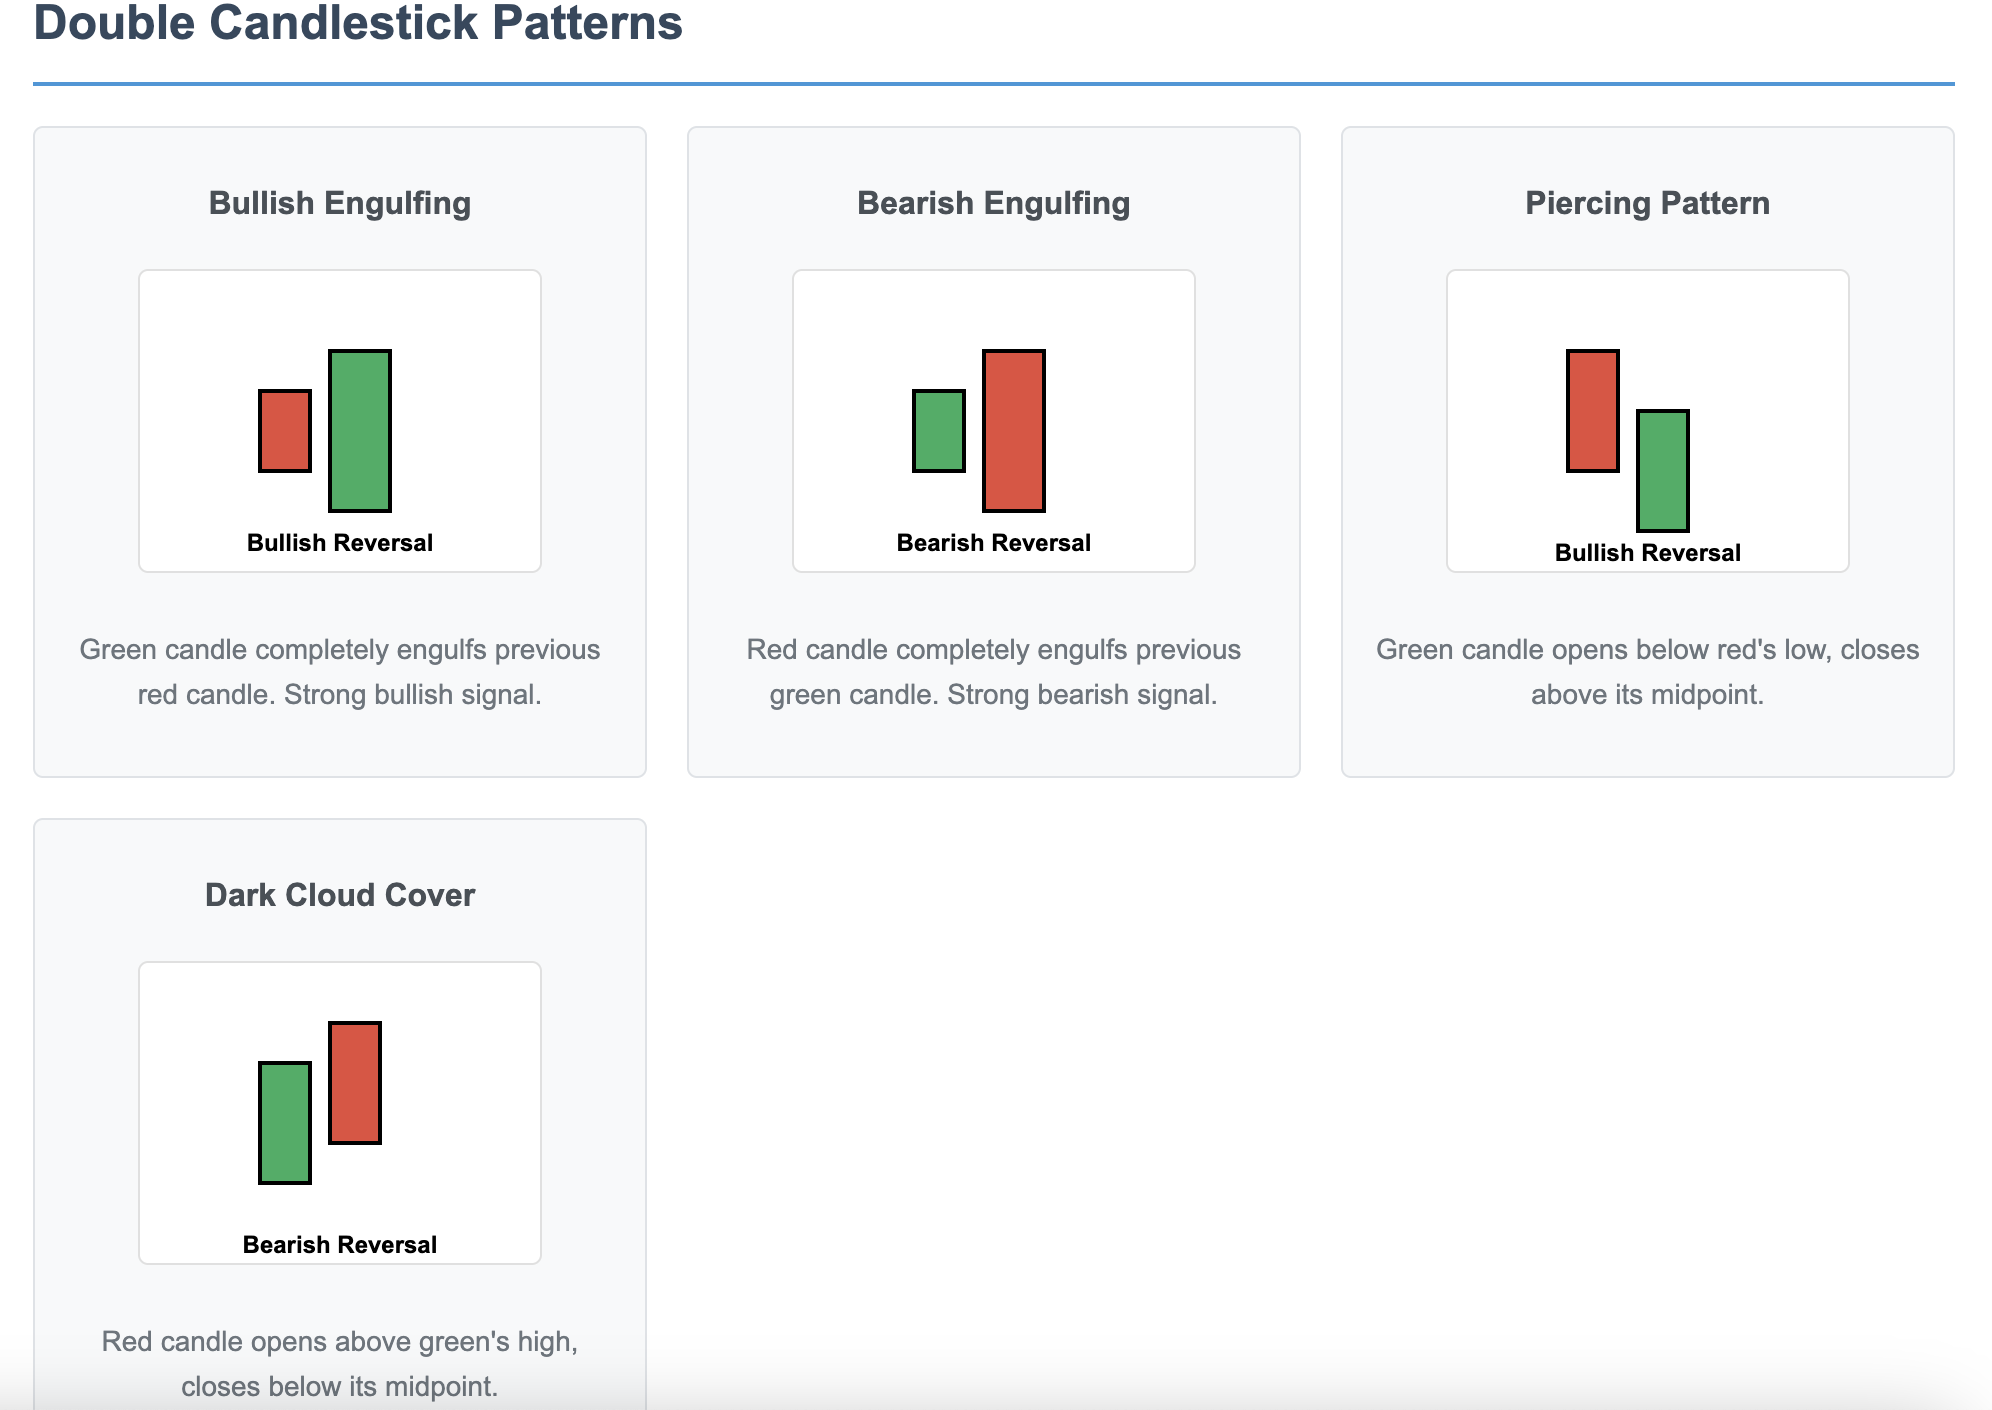
- Triple Candle Patterns:
- Morning Star: Bullish reversal (three candles)
- Evening Star: Bearish reversal (three candles)
- Three White Soldiers: Strong bullish continuation
- Three Black Crows: Strong bearish continuation
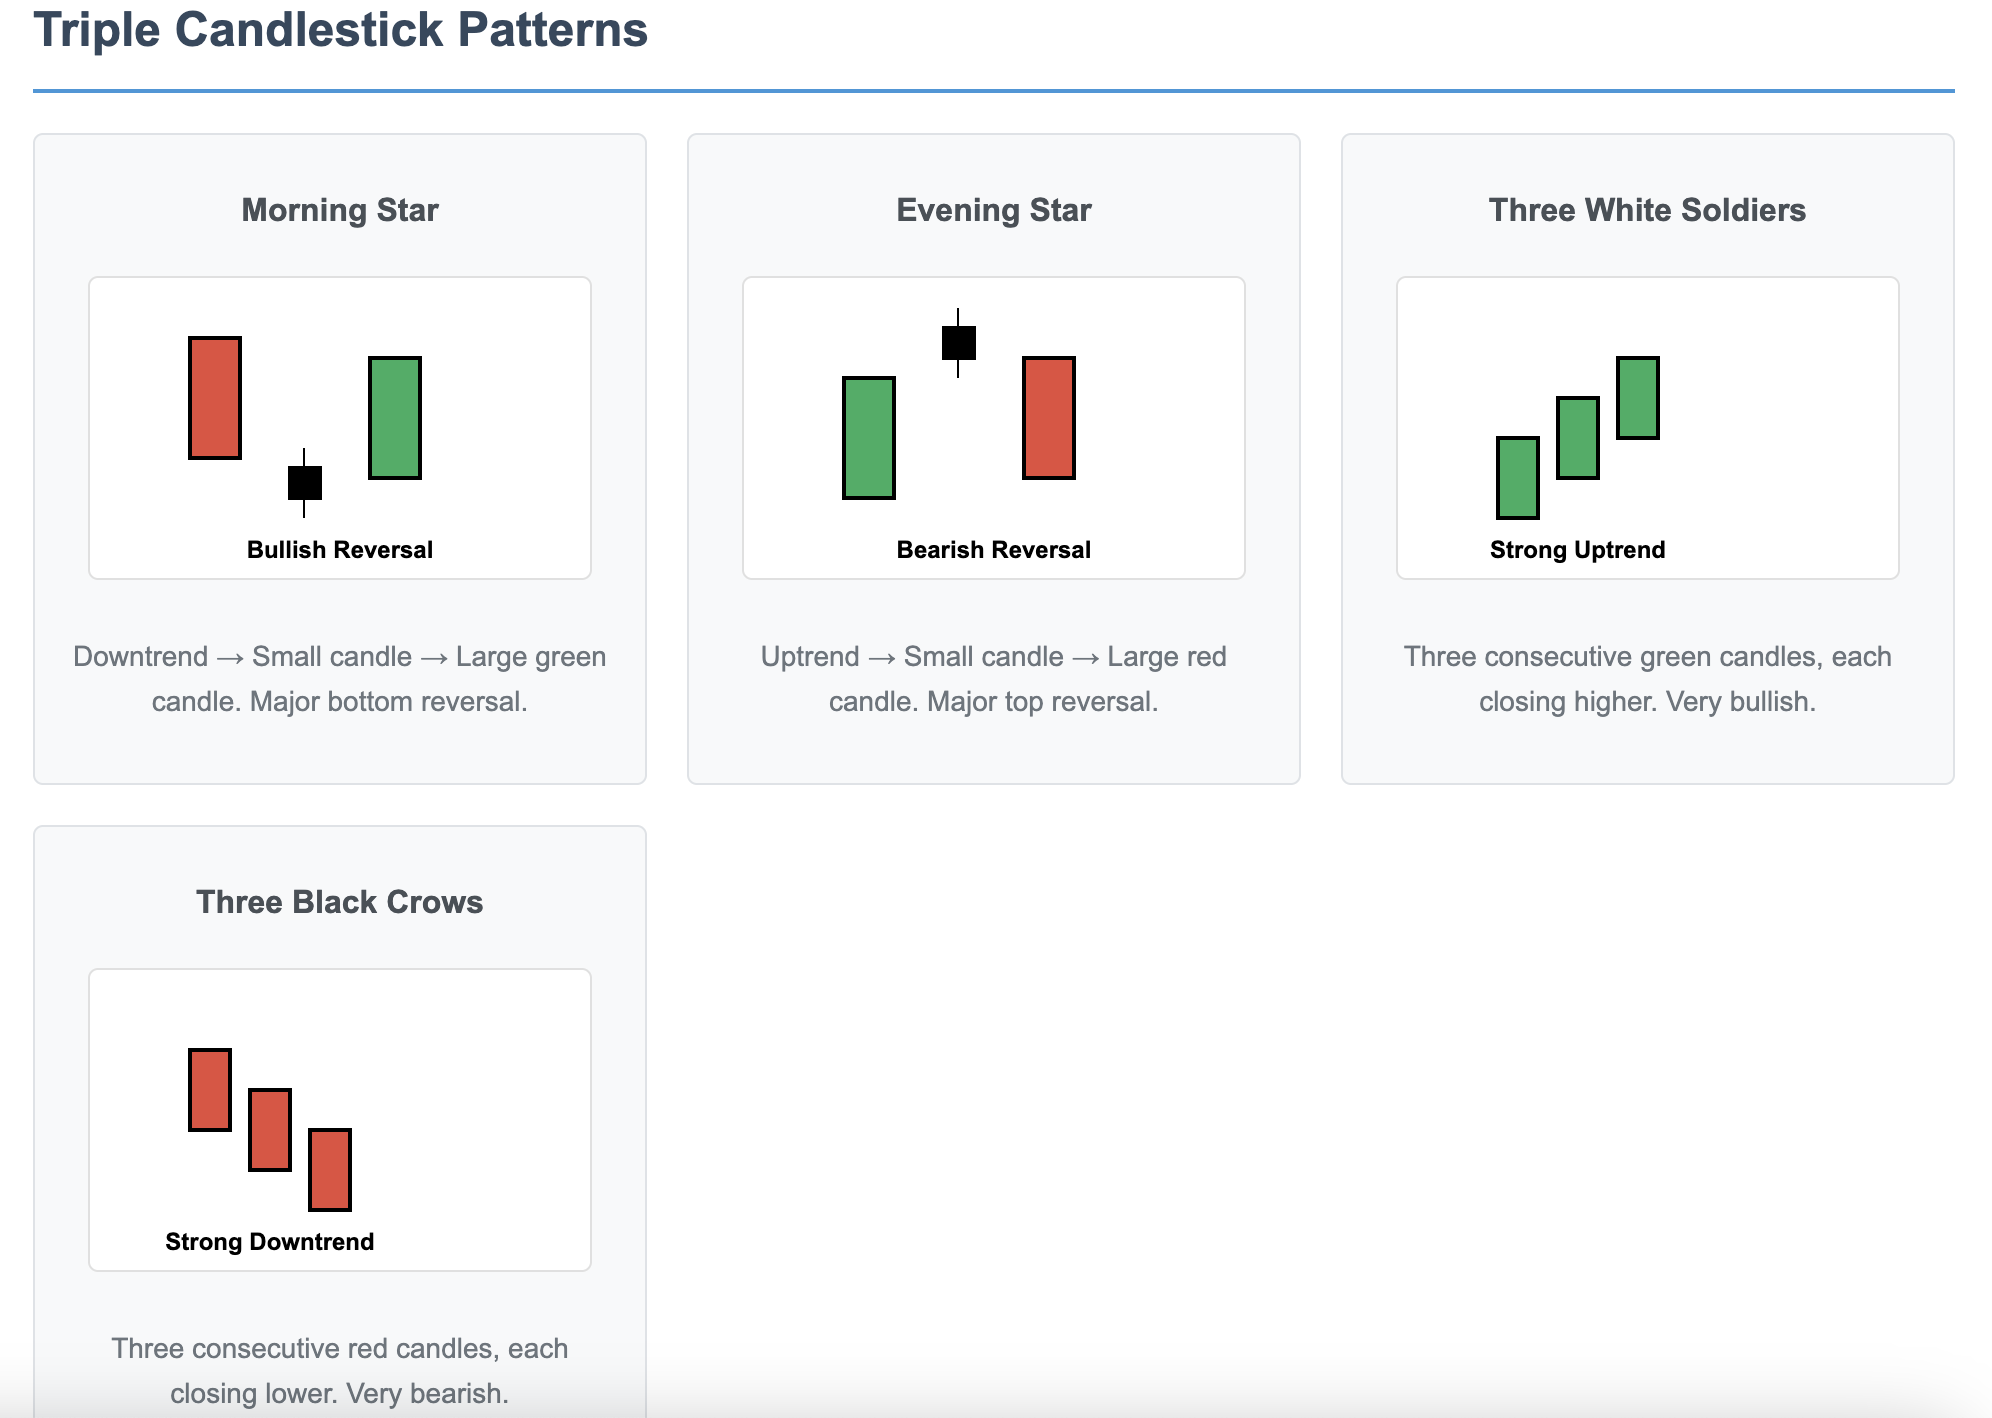
- Reliability increases with volume confirmation
- Chart Patterns
- Reversal Patterns:
- Head and Shoulders: Major trend reversal
- Double/Triple Tops: Resistance failure patterns
- Double/Triple Bottoms: Support holding patterns
- Cup and Handle: Bullish continuation after consolidation
- Rounding Bottom/Top: Gradual trend reversal
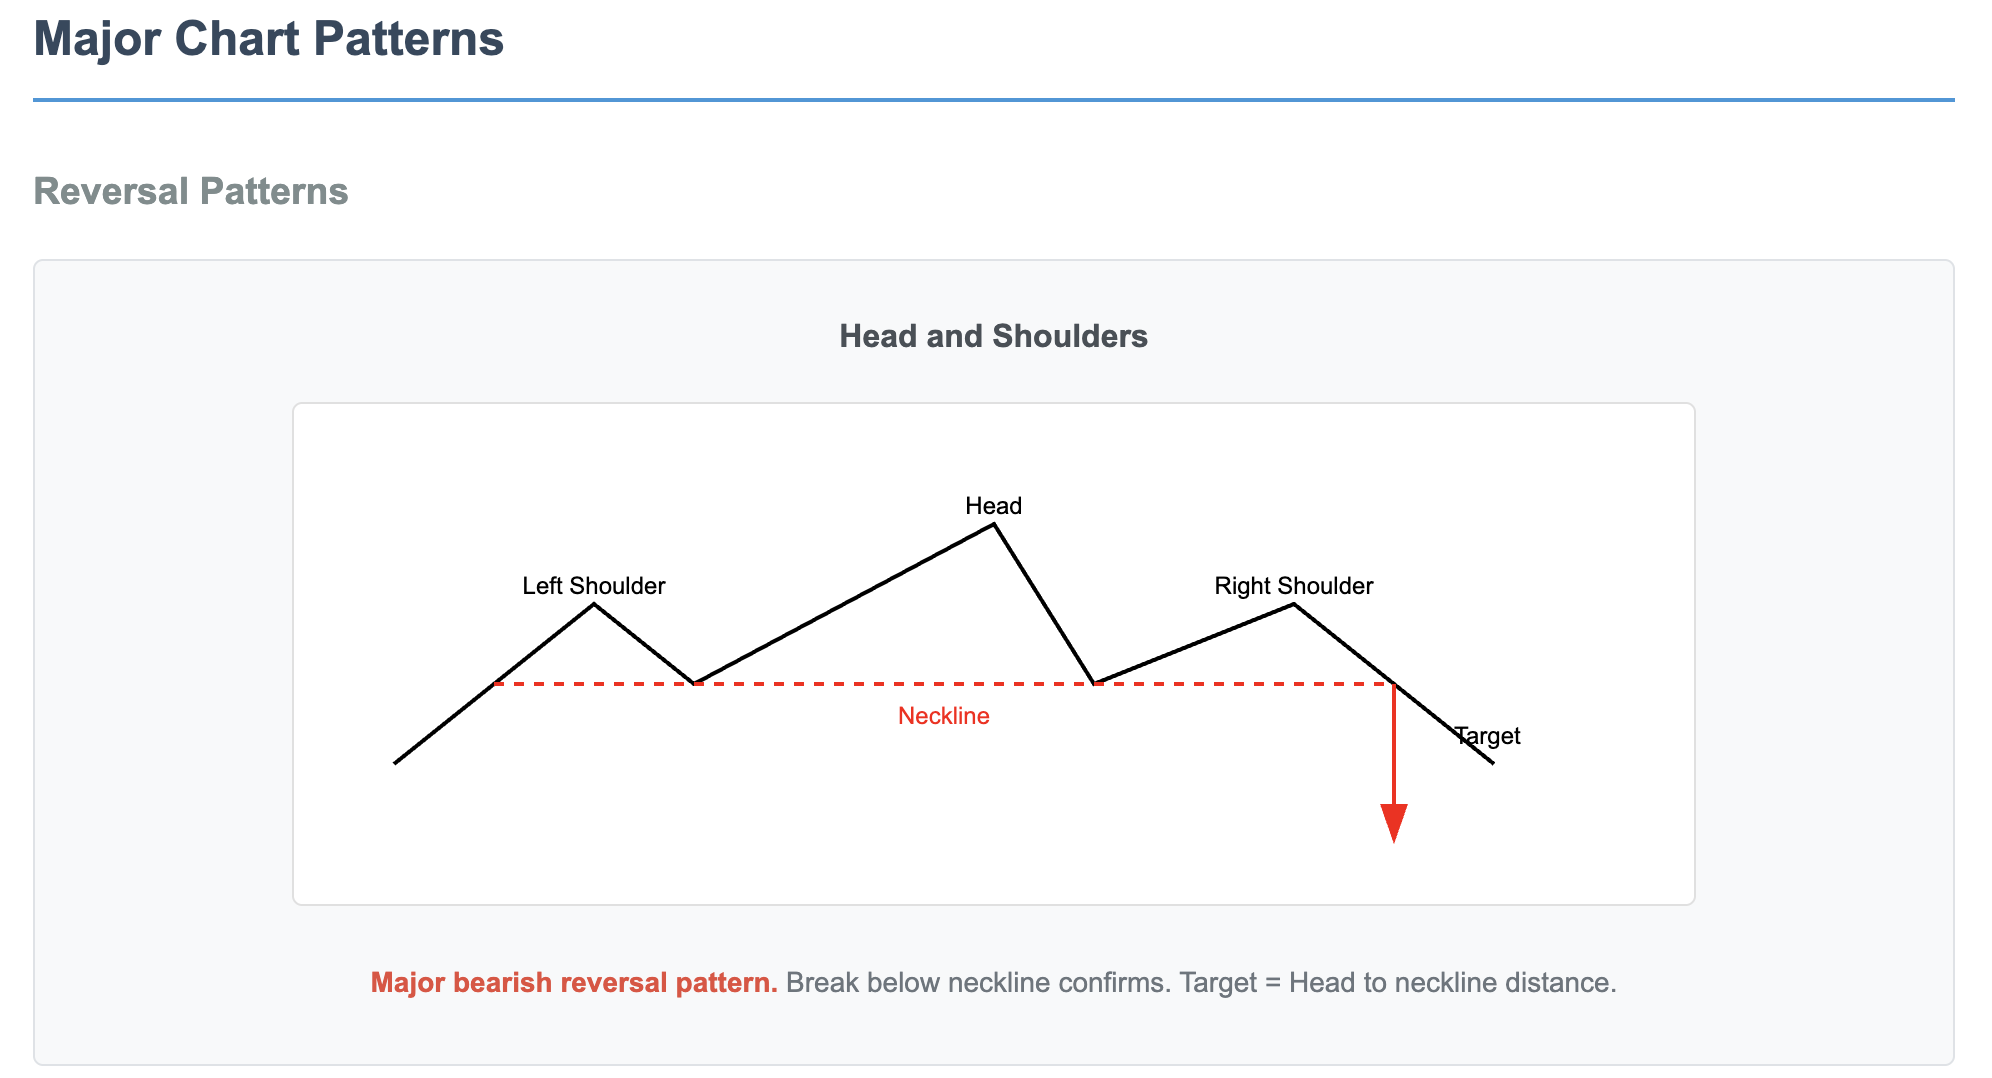
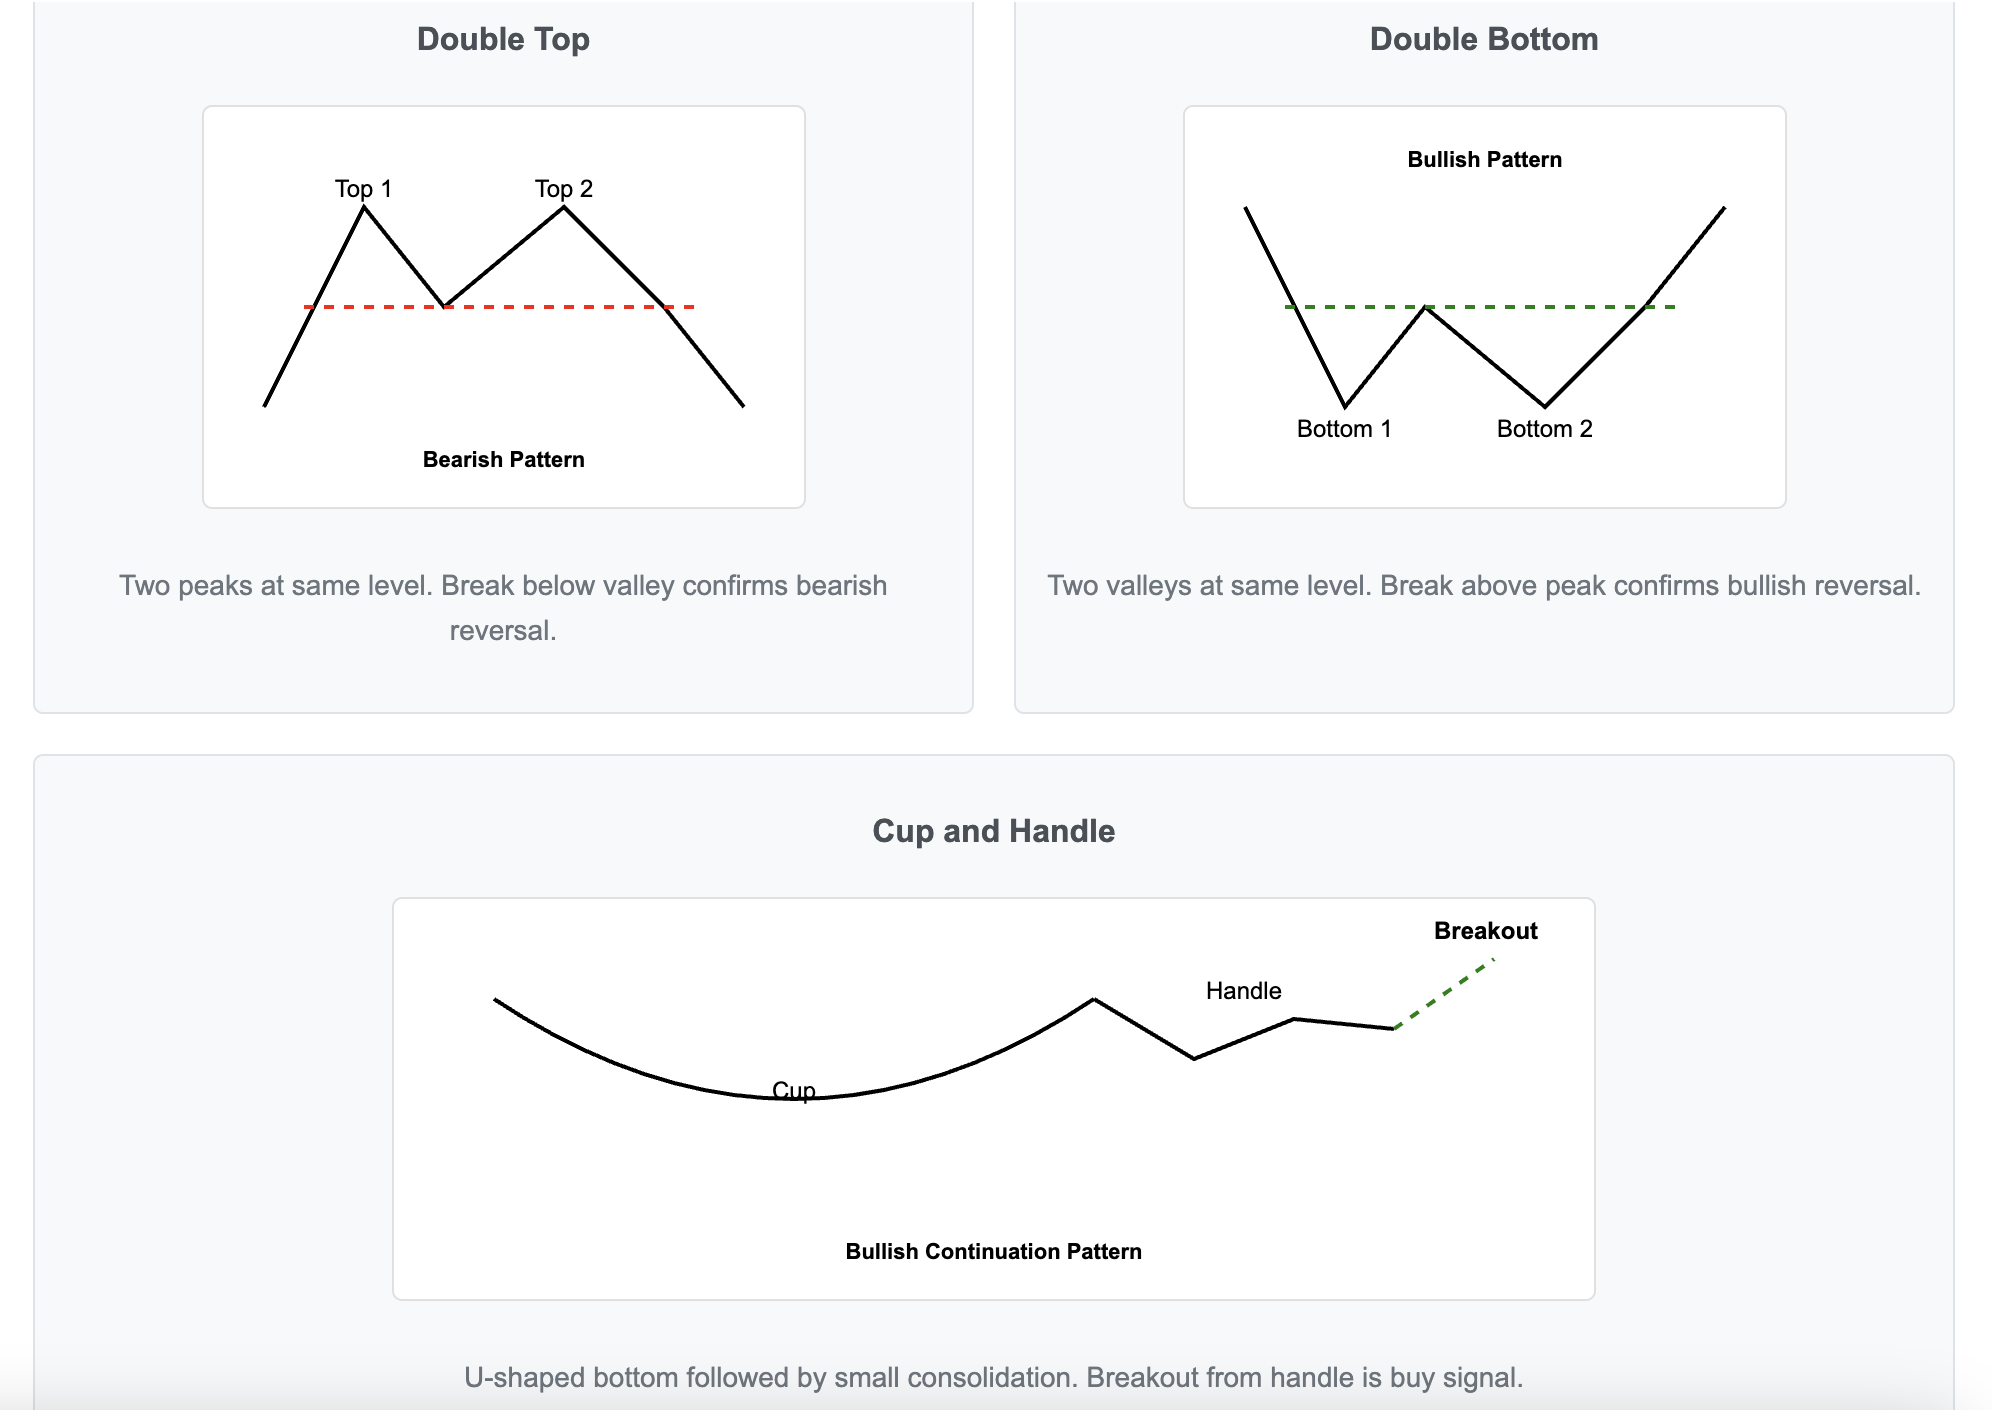
- Continuation Patterns:
- Flags: Brief consolidation in strong trend
- Pennants: Converging trendlines after sharp move
- Triangles: Ascending, descending, or symmetrical
- Rectangles: Horizontal consolidation ranges
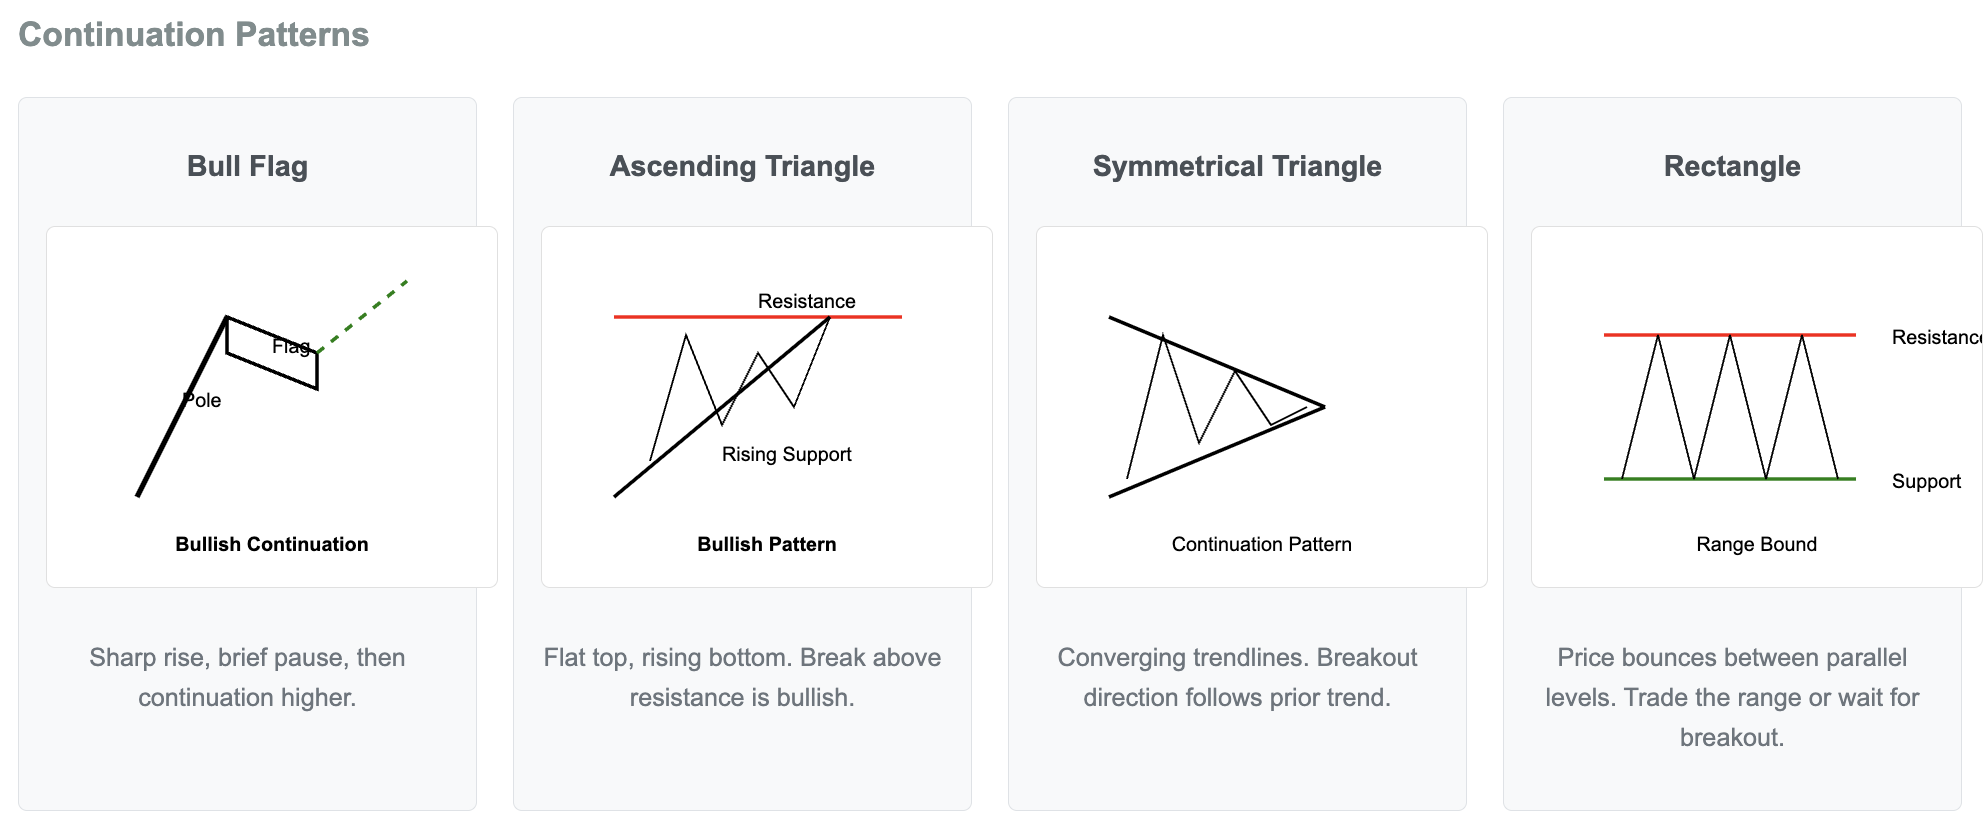
- Pattern reliability improves with:
- Clear structure and symmetry
- Volume confirmation at breakout
- Time frame (larger = more reliable)
- Reversal Patterns:
Qualitative Analysis Factors
- Business Model Assessment
- Competitive Moat Analysis:
- Network Effects: Value increases with more users
- Switching Costs: Expensive/difficult to change providers
- Brand Power: Premium pricing ability
- Cost Advantages: Structural low-cost position
- Regulatory Moats: Licenses, patents, permissions
- Scalability Evaluation:
- Operating leverage potential
- Market expansion opportunities
- Digital vs physical constraints
- Capital requirements for growth
- Revenue Quality:
- Recurring Revenue: Subscription models, contracts
- Transaction-Based: Volume dependent
- One-Time Sales: Project-based revenue
- Customer retention rates and churn
- Customer Analysis:
- Concentration risk (% from top customers)
- Geographic diversification
- Industry exposure
- Pricing power indicators
- Competitive Moat Analysis:
- Management Quality Evaluation
- Track Record Assessment:
- Past performance across cycles
- Previous company turnarounds
- Industry experience and expertise
- Educational and professional background
- Capital Allocation Skills:
- Return on incremental capital
- M&A track record
- Dividend/buyback decisions
- R&D and capex efficiency
- Corporate Governance:
- Board independence and expertise
- Executive compensation structure
- Related party transaction scrutiny
- Accounting quality and transparency
- Management Communication:
- Consistency in guidance
- Transparency during difficulties
- Long-term vision clarity
- Shareholder-friendly policies
- Track Record Assessment:
- Industry Analysis Framework
- Market Dynamics:
- Total Addressable Market (TAM) size
- Market growth rate and drivers
- Penetration levels and potential
- Industry life cycle stage
- Competitive Landscape:
- Market structure (fragmented vs concentrated)
- Barriers to entry and exit
- Competitive intensity
- Disruption threats
- Regulatory Environment:
- Government policy impact
- Regulatory changes pending
- Compliance costs
- Political risk factors
- Technology Disruption Risk:
- Digital transformation impact
- Automation possibilities
- New technology threats
- Innovation requirements
- Market Dynamics:
Alternative Valuation Methods
- Discounted Cash Flow (DCF) Analysis: Imagine someone offers you a choice: ₹100 today or ₹100 one year from now. You’d choose the money today because you could invest it and have more than ₹100 in a year. This is the core principle behind DCF analysis - future money is worth less than present money. The DCF method works by estimating all the cash a business will generate in the future and then calculating what that cash is worth today. Here’s how investors approach this: First, they project the company’s cash flows for the next 5-10 years. This involves estimating how revenues will grow, what profit margins will look like, and how much the company needs to invest to maintain growth. For example, if a company currently generates ₹100 crore in free cash flow and is growing at 15% annually, you might project ₹115 crore next year, ₹132 crore the year after, and so on. Next, they determine an appropriate discount rate, typically using the company’s Weighted Average Cost of Capital (WACC). This rate reflects the risk of the investment - riskier companies have higher discount rates. If the discount rate is 10%, then ₹110 received one year from now is worth ₹100 today. The terminal value represents what the company will be worth at the end of your projection period, assuming it continues operating indefinitely at a stable growth rate. Finally, all these future cash flows are discounted back to present value and summed up to get the company’s intrinsic value. DCF works best for stable, predictable businesses like consumer goods companies or utilities. It’s less reliable for cyclical businesses whose earnings fluctuate wildly with economic cycles, or for young companies without established cash flow patterns.
- Process Steps:
- Project free cash flows (5-10 years)
- Determine appropriate discount rate (WACC)
- Calculate terminal value
- Discount all cash flows to present value
- Limitations: Sensitive to assumptions, less suitable for cyclicals
- Process Steps:
- Enterprise Value Multiples: While DCF gives you an absolute value, enterprise value multiples help you compare companies quickly, even if they have different debt levels or tax situations. Enterprise value represents the total cost to buy the entire company, including taking on its debt. The EV/EBITDA ratio compares enterprise value to earnings before interest, taxes, depreciation, and amortization. This strips away the effects of different capital structures and accounting policies. A software company might trade at 20x EBITDA while a manufacturing company trades at 8x, reflecting their different growth prospects and capital requirements. For companies that aren’t yet profitable, EV/Sales becomes useful. High-growth SaaS companies often trade at 5-10x revenue because investors expect them to eventually achieve high profit margins. Traditional businesses might trade at just 1-3x revenue due to lower growth and margins. The EV/FCF ratio is particularly valuable because it’s based on actual cash generation rather than accounting earnings. Quality companies typically trade at 15-25x free cash flow, though this varies by industry and growth rate.
- EV/EBITDA:
- Definition: Enterprise value to operating earnings
- Typical Ranges: 8-15x depending on industry
- Best For: Comparing companies with different capital structures
- EV/Sales:
- Use Case: Loss-making growth companies
- SaaS Companies: Often 5-10x revenue
- Traditional Business: 1-3x revenue
- EV/FCF:
- Definition: Enterprise value to free cash flow
- Advantage: Based on actual cash generation
- Typical Range: 15-25x for quality companies
- EV/EBITDA:
- Sum-of-the-Parts (SOTP) Valuation: Some companies are like department stores with different sections that could each be valuable standalone businesses. Sum-of-the-parts (SOTP) valuation recognizes that a conglomerate’s divisions might be worth more separately than the market values them together. Consider a company that owns a profitable insurance business, a growing technology division, and some real estate. You’d value each segment using appropriate methods and multiples for that industry, then add them up and subtract the company’s net debt. Often, the market applies a “conglomerate discount” of 10-30% because these complex structures are harder to manage and less focused than pure-play companies.
- Application: Conglomerates with distinct segments
- Process:
- Value each segment separately
- Apply appropriate multiples per segment
- Sum all parts and subtract net debt
- Apply holding company discount if applicable
- Common Adjustments:
- Conglomerate discount (10-30%)
- Control premium for subsidiaries
- Tax implications of separation
Special Situation Investing
Beyond traditional value investing, special situations offer unique opportunities for those willing to do deep research and sometimes take contrarian positions.
- Turnaround Opportunities
- Key Indicators:
- New management team with proven track record
- Cost restructuring initiatives
- Non-core asset sales
- Debt reduction plans
- Industry cycle bottoming
- Analysis Focus:
- Cash burn rate and runway
- Debt maturity schedule
- Asset value vs market cap
- Early signs of improvement
- Risk Factors:
- Execution risk high
- Time to turnaround uncertain
- May need multiple quarters
- Key Indicators:
- Dividend Investing Strategy
- Key Metrics:
- Dividend Yield: Annual dividend/current price
- Payout Ratio: Dividends/earnings (prefer <60%)
- Dividend Coverage: Earnings/dividend (prefer >1.5x)
- Free Cash Flow Coverage: FCF/dividends
- Quality Indicators:
- Consecutive years of dividend growth
- Dividend growth rate vs inflation
- Management commitment to dividends
- Business stability and predictability
- Red Flags:
- Payout ratio >90%
- Borrowing to pay dividends
- Erratic dividend history
- Key Metrics:
- Value Investing Screens
- Classic Value Metrics:
- P/E < 15 with ROE > 15%
- P/B < 1 with positive earnings
- EV/EBITDA < 8 with growing revenue
- High FCF yield (>8%)
- Deep Value Situations:
- Net-nets (market cap < net current assets)
- Sum of parts discount >40%
- Activist investor involvement
- Hidden asset values
- Quality at Reasonable Price (QARP):
- Moderate valuations (P/E 15-25)
- High quality metrics (ROE >20%)
- Consistent growth record
- Strong balance sheet
- Classic Value Metrics:
- Volatility Indicators
- India VIX (Volatility Index):
- Below 15: Low volatility, potential complacency
- 15-20: Normal market conditions
- 20-30: Elevated uncertainty
- Above 30: Extreme fear/uncertainty
- Contrarian indicator at extremes
- VIX Futures:
- Shows expected future volatility
- India VIX (Volatility Index):
- Options Market Indicators
- Put-Call Ratio (PCR):
- Types:
- Volume-based PCR
- Open Interest PCR
- Interpretation:
- PCR > 1.3: Extreme bearishness (contrarian bullish)
- PCR < 0.7: Extreme bullishness (contrarian bearish)
- 0.9-1.1: Neutral sentiment
- Types:
- Options Pain Theory:
- Max pain levels act as magnets
- Skew Index:
- Reflects perception of tail risk
- Put-Call Ratio (PCR):
- Market Breadth Indicators
- Advance-Decline Ratio:
- Formula: Advancing stocks / Declining stocks
- Above 2: Very strong breadth
- 1.5-2: Strong breadth
- Below 0.5: Weak breadth
- Divergence with index: Warning signal
- New Highs-Lows Indicator:
- More new highs: Bullish market
- More new lows: Bearish market
- Shrinking new highs in a rally: Weakening signal
- Market Cap Participation:
- Compare large-cap vs mid-cap vs small-cap
- Broad participation is healthier than narrow
- Advance-Decline Ratio:
- Delivery and Investment Patterns
- Delivery Percentage:
- Above 60%: Strong investment demand
- 40-60%: Normal trading activity
- Below 40%: High speculative activity
- Cash Market Volumes:
- Higher volumes confirm directional moves
- DII Category Analysis:
- Breakdown by Insurance, Mutual Funds, and Others
- Delivery Percentage:
- Technical Market Indicators (others)
- McClellan Oscillator:
- Measures breadth momentum
- Above +100: Overbought breadth
- Below -100: Oversold breadth
- Zero line crossovers signal shifts in trend
- TRIN (Arms Index):
- Combines advances/declines with volume
- Below 1: Bullish pressure
- Above 1: Bearish pressure
- High-Low Index:
- Tracks percentage of stocks making new highs
- McClellan Oscillator:
Institutional Activity Tracking
- FII/DII Flow Analysis
- Data Points to Monitor:
- Daily net buying/selling in cash market
- Derivative positions and changes
- Sector-wise allocation shifts
- Monthly and yearly trends
- Interpretation Guidelines:
- Sustained FII buying: Bullish for market
- FII selling + DII buying: Domestic support
- Both selling: Bearish sentiment
- Divergence in derivatives vs cash: Hedging activity
- Sources: Exchange websites, NSDL/CDSL data
- Data Points to Monitor:
- Bulk and Block Deal Analysis
- Definitions:
- Bulk Deal: >0.5% of total shares in single transaction
- Block Deal: Large negotiated trades in separate window
- What to Look For:
- Identity of buyers/sellers
- Price levels of transactions
- Frequency of deals in specific stocks
- Post-deal price performance
- Significance: Shows institutional conviction levels
- Definitions:
- Shareholding Pattern Changes
- Quarterly Analysis Focus:
- Promoter holding changes
- FII/DII stake changes
- Mutual fund holdings
- Notable investor entries/exits
- Red Flags:
- Consistent promoter selling
- Multiple institutions exiting
- Increasing retail concentration
- Quarterly Analysis Focus:
Portfolio Risk Measurement
Risk management separates professional investors from gamblers. It’s not about avoiding risk entirely - that’s impossible in investing - but about understanding, measuring, and controlling it.
- Value at Risk (VaR): Value at Risk (VaR) estimates the maximum loss your portfolio might suffer over a specific period at a given confidence level. For example, a 95% daily VaR of ₹10 lakh means there’s only a 5% chance you’ll lose more than ₹10 lakh in a single day under normal market conditions.
- Definition: Maximum expected loss at given confidence level
- Parameters:
- Confidence Level: 95% or 99% typical
- Time Horizon: Daily, weekly, or monthly
- Portfolio Coverage: Individual positions or total
- Calculation Methods:
- Historical Simulation: Uses actual past returns
- Variance-Covariance: Assumes normal distribution
- Monte Carlo: Simulates thousands of scenarios
- Limitations: Doesn’t capture tail risk, assumes normal markets
- Conditional Value at Risk (CVaR): However, VaR has limitations - it doesn’t tell you how bad losses could be in that worst 5% of cases. That’s where Conditional Value at Risk (CVaR) comes in, measuring the expected loss when things go really wrong. This helps investors prepare for tail events like market crashes.
- Definition: Expected loss beyond VaR threshold
- Also Known As: Expected Shortfall or Tail VaR
- Advantages Over VaR:
- Captures tail risk severity
- More conservative measure
- Better for stress testing
- Applications: Risk budgeting, position limits
- Sortino Ratio: The Sortino ratio improves on the Sharpe ratio by only penalizing downside volatility. After all, investors don’t mind upside volatility - it’s the downside that hurts. A Sortino ratio above 1 indicates good risk-adjusted returns.
- Definition: Risk-adjusted return using only downside volatility
- Formula:
(Return - Target Return) / Downside Deviation - Advantages Over Sharpe:
- Doesn’t penalize upside volatility
- More relevant for investors
- Better for asymmetric returns
- Interpretation: Higher is better, >1 is good
- Maximum Drawdown Analysis: Maximum drawdown analysis reveals the largest peak-to-trough decline in your portfolio’s history. If your portfolio fell 40% during COVID-19, can you psychologically handle similar drops in the future? This metric tests your true risk tolerance.
- Metrics:
- Maximum Drawdown: Largest peak-to-trough decline
- Drawdown Duration: Time to recover losses
- Recovery Time: Peak to new peak period
- Risk Management Applications:
- Position sizing decisions
- Stop-loss levels
- Portfolio allocation
- Psychological Importance: Tests investor tolerance
- Metrics:
Keep your portfolio diversified investing in different instruments. Do other analysis like:
- Macro and Sector Rotation
- Monitor sector performance rotation
- Track global market correlations
- Currency and commodity impacts
- Interest rate sensitivity analysis
- Event-Based Analysis
- Earnings season patterns
- Budget and policy impacts
- Global event correlations
- Expiry week behaviors
- Quantitative Signals
- Momentum rankings and changes
- Relative strength comparisons
- Mean reversion opportunities
- Pairs trading setups
- Risk-On vs Risk-Off Indicators
- High-beta vs low-beta performance
- Growth vs value rotation
- Credit spread movements
- Safe haven asset flows
Tax Saving Strategy
Earning money is great, but being able to minimize taxes legally is even better.
Tax Planning Fundamentals
- Choosing Your Tax Regime: Evaluate whether old regime (higher rates with deductions) or new regime (lower rates, minimal deductions) suits your financial profile better
- Strategic Planning Principle: Tax saving should complement your financial goals, not drive them - avoid tail wagging the dog syndrome
- Year-Round Approach: Successful tax planning happens throughout the year, not just in March rush
Capital Gains Tax Strategies
- Tax Gain Harvesting for Equities:
- LTCG up to ₹1 lakh is tax-free annually - use this exemption strategically
- When unrealized gains approach ₹1 lakh, sell and immediately repurchase
- Example: Shares bought at ₹3 lakh, now worth ₹3.95 lakh - sell and rebuy to book ₹95,000 tax-free, reset cost to ₹3.95 lakh
- This shields future gains from tax by updating your purchase price
- Strategic Loss Booking:
- Offset profitable positions with loss-making ones to reduce tax liability
- Sell both gainers and losers, then repurchase losers if you believe in recovery
- No wash sale rules in India - can repurchase immediately
- Trading Tax Traps to Avoid:
- Intraday profits: Taxed at income slab rates (up to 30%), not flat 15% like delivery trades
- BTST risks: Can attract 20% auction penalty if delivery fails - avoid unless expert
- Loan-funded investing: Never buy stocks through loans for dividend tax benefits - extremely risky
Property and Real Estate Benefits
- Section 54 Capital Gains Exemption:
- Reinvest property sale gains (under ₹2 crore) in up to 2 residential properties
- Complete tax exemption on capital gains - but usable only once in lifetime
- Must reinvest within specified time limits (1 year for completed property, 3 years for construction)
- Smart Home Loan Structuring:
- Buy property in spouse’s name if they’re in lower tax bracket
- Both co-owners claim proportionate benefits:
- Section 24: Up to ₹2 lakh on home loan interest
- Section 80C: Up to ₹1.5 lakh on principal repayment
- Combined tax reduction potential: ₹3.5 lakh annually per person
- Reverse Mortgage Warning: Never opt for reverse mortgage plans - poor value proposition despite tax benefits
Investment-Based Deductions
- PPF (Public Provident Fund):
- Triple tax benefit: EEE status (investment, interest, maturity all tax-free)
- Current rate: 7.1% with 15-year lock-in
- Ideal for risk-averse long-term wealth creation
- National Pension System (NPS):
- Regular 80C limit: ₹1.5 lakh under 80CCD(1)
- Additional: ₹50,000 under 80CCD(1B)
- Employer contribution under 80CCD(2): No upper limit, up to 10% of basic salary
- Total potential deduction: ₹2 lakh + employer contribution
- Government Schemes by Demographics:
- Sukanya Samriddhi: 8.2% for girl child, tax-free maturity
- Atal Pension Yojana: ₹42-1,454 monthly contribution for guaranteed pension
- Senior Citizen Savings: 8.2% quarterly interest, ₹30 lakh limit
- PMJJBY/PMSBY: Life and accident insurance at minimal premiums
- Investment Products to Avoid:
- ULIPs: Poor returns despite tax benefits - buy term insurance + ELSS instead
- Endowment Plans: Low returns masked by tax savings pitch
- Gold ETFs: Taxed at 20% or slab rate - prefer Sovereign Gold Bonds held till maturity
Medical and Health Deductions
- Section 80D Health Insurance:
- Self/spouse/children: ₹25,000 (₹50,000 if senior citizen)
- Parents: Additional ₹25,000 (₹50,000 if senior)
- Preventive health check: ₹5,000 within limits
- Maximum possible: ₹1 lakh (self and parents both senior citizens)
- Disability-Related Deductions:
- 80DD (Dependent disability): ₹75,000 for 40-80%, ₹1.25 lakh for severe
- 80U (Self disability): Same limits as 80DD
- 80DDB (Critical illness): ₹40,000 general, ₹1 lakh for seniors
- Strategic Health Planning: Structure separate policies for parents to maximize 80D benefits rather than single family floater
Education and Special Loans
- Section 80E Education Loan:
- Interest fully deductible for 8 years - no upper limit
- Covers higher education in India or abroad
- Strategic tip: Take loan even if you have funds, invest cash in higher-return instruments
- Section 80EEB Electric Vehicle:
- Additional ₹1.5 lakh deduction on EV loan interest
- Over and above all standard deductions
- Makes EVs financially attractive with lower running costs
Rental and Housing Benefits
- HRA Optimization Strategies:
- Pay rent to parents if living with them - they claim 30% standard deduction
- Rent receipts above ₹1 lakh monthly need landlord PAN
- Calculate HRA exemption: Least of actual HRA, rent minus 10% salary, or 50%/40% of basic
- Section 80GG (No HRA from Employer):
- Maximum ₹5,000 monthly (₹60,000 annual) deduction
- Cannot own property in work city
- Calculate least of: ₹5,000/month, 25% of income, or rent minus 10% income
Charitable Giving and Donations
- Section 80G Donation Benefits:
- 100% deduction unlimited: PM Relief Fund, National Defence Fund
- 100% with limits: Specific government funds (10% of adjusted gross income)
- 50% deduction: Most charitable trusts, religious institutions
- Cash donations above ₹2,000 disallowed - use digital payments
- Political Contributions:
- 80GGC for individuals, 80GGB for companies
- Full deduction but must be non-cash
- No limit on amount
Agricultural and Rural Benefits
- Tax-Free Agricultural Income:
- Complete exemption under Section 10(1)
- Includes farmland income, agricultural operations
- Farmhouse income (subject to distance conditions)
- Proper documentation crucial for scrutiny
- Section 54B: No tax on agricultural land sale if reinvested in agricultural land within 2 years
Gift Tax Optimization
- Tax-Free Gifts from Relatives:
- No limit from parents, spouse, siblings, in-laws
- Strategic income splitting within family possible
- Maintain gift deeds and relationship proof
- Gifts from Others:
- Cash/cheque: ₹50,000 annual limit
- Marriage gifts: No limit from anyone
- Property gifts: Stamp duty value matters if >₹50,000
- Gift Tax Table: Monetary threshold triggers tax on entire amount, not just excess
Advanced Planning Techniques
- Hindu Undivided Family (HUF):
- Separate tax entity with own PAN and exemption limit
- Splits income among family members legally
- Particularly useful for ancestral property income
- Income Timing Strategies:
- Defer bonuses or income to lower tax years
- Prepay expenses in high-income years
- Advance tax payments to avoid interest penalties
- Minor’s Income Planning:
- Clubbed with parent’s income but ₹1,500 per child exempt
- Income from minor’s manual work/skill not clubbed
- Plan investments to utilize exemption
Quick Reference: Maximum Deductions
- Section 80C + 80CCD: ₹2 lakh (₹1.5 lakh + ₹50,000 NPS)
- Section 80D: Up to ₹1 lakh (specific conditions)
- Section 80E: Unlimited (education loan interest)
- Section 80G: Varies by donation type
- Section 24: ₹2 lakh (home loan interest)
- Section 80EEB: ₹1.5 lakh (EV loan interest)
- Section 80TTA/TTB: ₹10,000/₹50,000 (savings interest)
Futures Options
(Touching things at a high level)
Part 1
- Futures and Options (F&O) are the two main types of financial derivatives. A derivative is a contract that derives its value from an underlying asset, such as a stock, a commodity (like gold), or an index (like the S&P 500).
- A Futures Contract is a binding agreement to buy or sell an asset at a predetermined price on a specific future date.
- The Obligation: Both the buyer and the seller are obligated to fulfill the contract, regardless of the market price at the time of expiry.
- The Cost: You don’t pay the full price upfront. Instead, you deposit a margin (a fraction of the total value) with the broker.
- Detailed Example: Trading Gold Futures:
Imagine Gold is currently trading at $2,000/oz. You believe the price will rise by next month. The Trade: You enter a futures contract to buy 100 oz of gold at $2,000 in 30 days. Scenario A (Price Rises): Gold goes to $2,200. You are still allowed to buy it at the contract price of $2,000. Your Profit: ($2,200 - $2,000) × 100 oz = $20,000 profit. Scenario B (Price Falls): Gold drops to $1,800. You are legally forced to buy it at $2,000, even though it's only worth $1,800 in the market. Your Loss: ($2,000 - $1,800) × 100 oz = $20,000 loss. - Another way to explain: A Futures Contract is an obligation to buy/sell an asset at a specific price on a specific date.
- Lot Size: You cannot trade 1 share. You trade a “lot”. Example: Reliance Lot size = 250.
- Buying 1 Futures contract = Exposure to 250 shares.
- Expiry: Contracts in India expire on the last Thursday of the month (if Thursday is a holiday, then Wednesday). Cycles: Near Month (Current), Next Month, Far Month.
- Margin & Leverage: You don’t pay the full value. You pay a “performance bond” called Margin. Example: Contract Value = ₹5 Lakhs. Margin required ≈ ₹1 Lakh (approx 20%). Leverage = 5x.
- Mark-to-Market (M2M): Profits and losses are settled daily in cash. Scenario: You bought Nifty Futures at 20,000. It closes at 20,100. The exchange credits ₹100 x Lot Size to your account that evening. If it falls to 19,900, they debit it.
- Spot Price vs Futures Price:
- Spot: Current market price of the share (Cash market).
- Future: Usually trades at a premium to Spot due to “Cost of Carry” (Interest cost).
- Formula: $Future Price = Spot Price + Cost of Carry
- Convergence: On expiry day, Future Price = Spot Price.
- Cash Carry Arbitrage: Buying the stock in the Cash market and selling the Future (if Future is overpriced) to lock in a risk-free profit equal to the interest rate.
- What are Options?: An Options Contract gives you the right, but not the obligation, to buy or sell an asset at a set price.
- The Choice: If the deal is bad for you, you can simply let the contract expire and walk away.
- The Cost: To get this “right,” you must pay a non-refundable fee called a Premium. ``` A. Call Options (The right to BUY) You buy a Call if you think the price will go up. Detailed Example: Suppose Stock X is at $100. You buy a Call Option with a “Strike Price” of $100 for a $5 premium. Total Cost: $5. Scenario A (Price hits $130): You exercise your right to buy at $100 and sell it immediately for $130. Profit: $30 (gain) - $5 (premium) = $25 Net Profit. Scenario B (Price drops to $70): You choose not to buy the stock for $100 because it’s cheaper in the market. You let the option expire. Loss: Only the $5 premium.
B. Put Options (The right to SELL) You buy a Put if you think the price will go down. Detailed Example: You own Stock Y at $100. You fear a crash, so you buy a Put Option with a strike of $100 for a $5 premium. Scenario A (Price drops to $60): You exercise your right to sell at $100. Net Result: Even though the market price is $60, you sold at $100. Your “profit” on the option ($40 - $5 premium = $35) offsets the loss on your actual stock. Scenario B (Price rises to $150): You don’t want to sell at $100! You let the option expire and keep your stock. Loss: Only the $5 premium.
- Another way to explain: An Option gives the buyer the right (but not obligation) to buy/sell. The seller (writer) has the obligation.
- The Basics
  - Call Option (CE): Buy if you think the market will go UP.
  - Put Option (PE): Buy if you think the market will go DOWN.
  - Strike Price: The price at which you agree to buy/sell.
  - Premium: The price you pay to buy the option contract.
- Moneyness
  - ITM (In The Money): Has intrinsic value (e.g., Call Strike 100, Spot is 110).
  - ATM (At The Money): Strike ≈ Spot.
  - OTM (Out of The Money): No intrinsic value, purely time value (e.g., Call Strike 120, Spot is 110).
  - The Option Greeks
  - Delta: How much option price changes for a 1 point move in the underlying.ATM Delta is usually 0.5. If Nifty moves up 100 points, ATM Call increases by 50.
  - Gamma: Rate of change of Delta. Explains how fast Delta changes. High Gamma = Explosive moves (common on Expiry day).
  - Theta: Time Decay. How much value the option loses every day as it nears expiry. This is the "enemy" of the buyer and "friend" of the seller.
  - Vega: Sensitivity to Volatility. If Volatility (IV) goes up, option premiums become expensive.4.
- Volatility Terms
  - India VIX: The "Fear Index."High VIX (>20): Expect wild swings; Option premiums are expensive (good for selling spreads).Low VIX (<12): Market is complacent; Premiums are cheap (good for buying).
  - IV (Implied Volatility): The market's expectation of future volatility for that specific stock.

| Feature | Futures | Options |
| :--- | :--- | :--- |
| **Obligation** | **Mandatory** for both parties to fulfill the contract. | **Optional** for the buyer; **Mandatory** for the seller if the buyer exercises. |
| **Risk** | **Unlimited** potential for both profit and loss. | **Limited** to the Premium for the buyer; **Unlimited** for the seller. |
| **Upfront Cost** | **Margin** (A refundable deposit, though subject to daily mark-to-market). | **Premium** (A non-refundable fee paid by the buyer to the seller). |
| **Profit Potential** | **Unlimited** as the price moves in your favor. | **Unlimited** for Call buyers; **High** for Put buyers. |

- Why use one over the other?: Use Futures if you are very confident in the direction of the market and want to avoid paying a premium. It is a high-stakes, high-reward tool. Use Options if you want to limit your "downside" (loss) while still participating in the "upside" (gain). It acts like an insurance policy for your portfolio.
- OTC vs. Exchange Traded:
  - OTC (Over-the-Counter): Private agreements between two parties (e.g., You and a friend agree to exchange dollars next month). High counterparty risk (the other guy might run away). Forwards are OTC contracts.
  - Exchange Traded: Standardized contracts traded on a regulated exchange (NSE/BSE). The exchange guarantees the trade, removing counterparty risk. Futures and Options are exchange-traded

- Margin Types
  - SPAN Margin: The base margin calculated based on risk/volatility (covers 99% of worst-case moves).
  - Exposure Margin: Additional margin blocked by brokers (safety net).
  - Total Margin: SPAN + Exposure.
  - Margin Call: If your account balance falls below the required margin, the broker demands more money. If not paid, they square off your position.
- Order Types like: MIS (Margin Intraday Square-off): Intraday only, Lower margin, but auto-squared off at 3:15 PM; Cover order (discussed in past), etc...

- Shorting
  - Spot Market: You can short (sell first, buy later) only for Intraday. You must buy them back before 3:20 PM. You cannot carry it overnight.
  - F&O Market: You can short Futures or Buy Puts and carry them overnight/days/weeks. This is the only way to hold a bearish position for days.

- Data Analysis & Indicators
  - Open Interest (OI): Total number of open contracts in the market.
    - Price UP + OI UP: Long Build-up (Bullish).
    - Price DOWN + OI UP: Short Build-up (Bearish).
    - Price DOWN + OI DOWN: Long Unwinding (Weak Bullish trend ending).
    - Price UP + OI DOWN: Short Covering (Bears are exiting, explosive upmove possible).
  - PCR (Put Call Ratio): Total Put OI / Total Call OI.
    - PCR > 1.5: Oversold (Market might bounce).
    - PCR < 0.5: Overbought (Market might fall).
  - Max Pain: The strike price where the option writers (sellers) will lose the least amount of money. The market often "gravitates" to this price on expiry.
  - Option Chain: A table showing OI, Volume, IV, and Premiums for all strikes. Used to identify Support (High Put OI) and Resistance (High Call OI).

- Strategies
  - Bullish Strategies
    - Long Call: Buy CE. (High risk, defined loss).
    - Bull Call Spread: Buy ATM Call + Sell OTM Call. (Reduces cost, caps profit, hedges volatility).
    - Call Ratio Back Spread: Sell 1 ITM Call + Buy 2 OTM Calls. (For unlimited upside with limited downside).
  - Bearish Strategies
    - Long Put: Buy PE.
    - Bear Put Spread: Buy ATM Put + Sell OTM Put.
    - Bear Call Ladder: Sell ATM Call + Buy OTM Call + Buy another higher OTM Call.
  - Neutral / Range Bound Strategies (Theta Eaters)
    - Short Straddle: Sell ATM Call + Sell ATM Put. (Profits if market stays flat).
    - Short Strangle: Sell OTM Call + Sell OTM Put. (Safer than straddle).
    - Iron Condor: A Strangle with "wings" (hedges). Sell OTM Call + Buy Far OTM Call (Protection) AND Sell OTM Put + Buy Far OTM Put (Protection). Defined risk, defined reward.
  - Volatility Strategies
    - Long Straddle: Buy ATM Call + Buy ATM Put. (Profits if market moves massively in any direction). Use before big events (Election results, Budget).

- Trailing Stop Loss (Protecting Profits): Instead of a fixed Stop Loss (SL) at 100, you use a Trailing SL. Example: You buy at 100. SL at 90. Price moves to 110. You move SL to 100 (Cost). Price moves to 120. You move SL to 110. Benefit: If the market crashes from 120, you exit at 110, locking in a profit, rather than exiting at your original 90 loss.

- The "Physical Settlement" Danger Zone
  - This is unique to Indian Stock F&O (Does not apply to Nifty/BankNifty).
  - The Rule: If you hold a Stock Future or an In-The-Money (ITM) Option until the moment of expiry (Thursday 3:30 PM), you generally cannot just settle in cash. You must physically take/give delivery of shares.
  - The Delivery Margin Trap (Expiry Week):
    - Friday (E-4 days): Exchange asks for 10% of full contract value.
    - Monday (E-3 days): 25% margin.
    - Tuesday (E-2 days): 45% margin.
    - Wednesday/Thursday: Up to 100% of contract value.
  - Real World Example: You bought 1 lot of Reliance Calls. Premium paid: ₹5,000. If you hold till expiry and it expires ITM, you might suddenly be asked to pay ₹6 Lakhs (Contract Value) to take delivery of 250 shares.
  - Solution: Always close Stock F&O positions by the Tuesday of expiry week unless you actually want to buy/sell the shares for crores.

- Cash Carry Arbitrage (Risk-Free Returns)
This is a strategy used by wealthy traders/funds to earn interest-like returns. Concept: Futures usually trade at a Premium to Spot prices. Spot Price: 100 Future Price: 101 (The ₹1 difference is the interest/cost of carry). The Trade: Buy 1 Lot of Shares in Cash Market (Spot) @ 100. Sell 1 Lot of Futures @ 101. The Result: On expiry day, Spot and Future prices MUST become equal. If price goes to 110: You gain ₹10 in Cash shares, lose ₹9 in Futures. Net Profit = ₹1. If price goes to 90: You lose ₹10 in Cash shares, gain ₹11 in Futures. Net Profit = ₹1. Why do it? It acts like a fixed deposit. If the spread is high (e.g., Future is trading 1% higher for a 1-month expiry), you lock in a 12% annualized return risk-free. ```
- Hedging with Futures (Portfolio Protection): Assume you have a Stock Portfolio worth ₹10 Lakhs (Long-term holdings). You are afraid the market will crash 10% next month due to election results, but you don’t want to sell your shares.
- The Hedge: You Short Sell Nifty Futures. Calculation for Beta Hedging - If your portfolio Beta is 1.0, you short ₹10 Lakhs worth of Nifty Futures.
- Outcome:
- If Market Crashes: Your Portfolio loses value, but your Short Nifty Future gains value. The profit offsets the loss.
- If Market Rallies: You lose on the Future, but gain on the Portfolio.
- Goal: To neutralize risk temporarily.
- Market Cycles (Daily/Weekly/Monthly)
- Monthly Contracts: Stocks (Reliance, HDFC, etc.): ONLY Monthly expiry (Last Thursday of the month). No weekly options for stocks. Indices: Also have monthly contracts.
- Weekly Contracts (The “Zero Day” Action): Indices have Weekly Expiry. This has created a phenomenon where almost every day is an expiry day for some index, leading to high retail volume. Monday: BSE EXCH (Bankex) / Nifty Midcap Select; Tuesday: FINNIFTY (Financial Services); Wednesday: BANKNIFTY; Thursday: NIFTY 50; Friday: BSE SENSEX.
- Daily Contracts: Do not exist in Indian Equity derivatives yet. (Available in Commodities/Forex in some global markets, but not NSE Equity).
Other Info
- None for now.