Working with Spark & Flink
05 Apr 2025From my experience working at Simpl.
In this article, I have jotted down my understanding around Spark and Flink.
Spark
Basic Architecture:
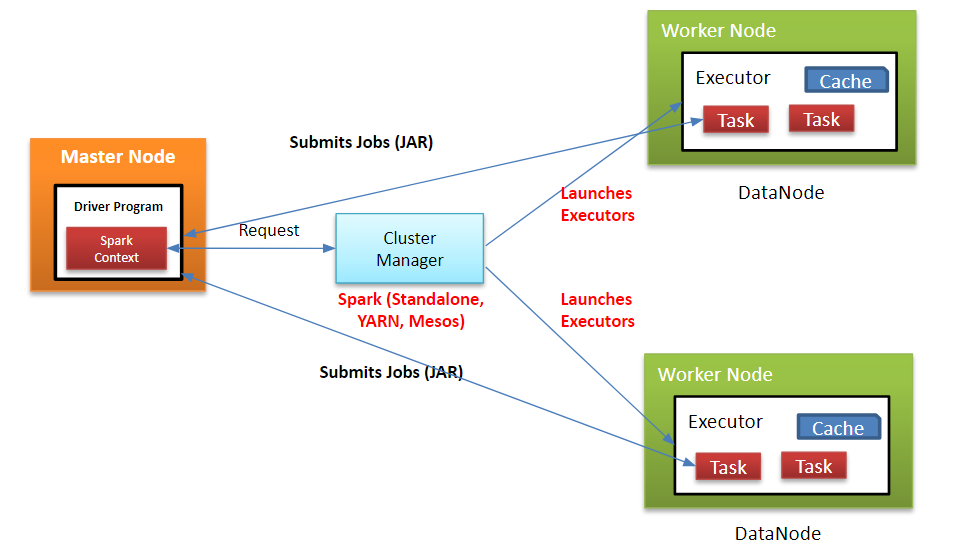 (Image source: ref)
Apache Spark is an open-source distributed computing system designed for big data processing and analytics. Spark is known for its speed and efficiency. Spark enables applications to run faster by utilising in-memory cluster computing.
The Apache Spark framework uses a master-slave architecture that consists of a driver, which runs as a master node, and many executors that run across as worker nodes in the cluster. Apache Spark can be used for batch processing and real-time processing as well.
Spark Driver: It is the master node of the Spark application. It is responsible for:
- Converting user programs into a Directed Acyclic Graph (DAG) of tasks.
- Scheduling tasks on executors and managing their execution.
- Monitoring the state of the application and coordinating with the cluster manager.
- The driver runs the main() function of the application and creates the SparkContext, which is the entry point for all Spark functionality.
Executors: They are worker nodes that execute tasks assigned by the driver. Each Spark application has its own executors, which are responsible for:
- Running individual tasks.
- Storing data in memory or disk storage as needed.
- Reporting back the status and results of tasks to the driver.
- Executors run in separate JVM processes and can be distributed across multiple nodes in a cluster.
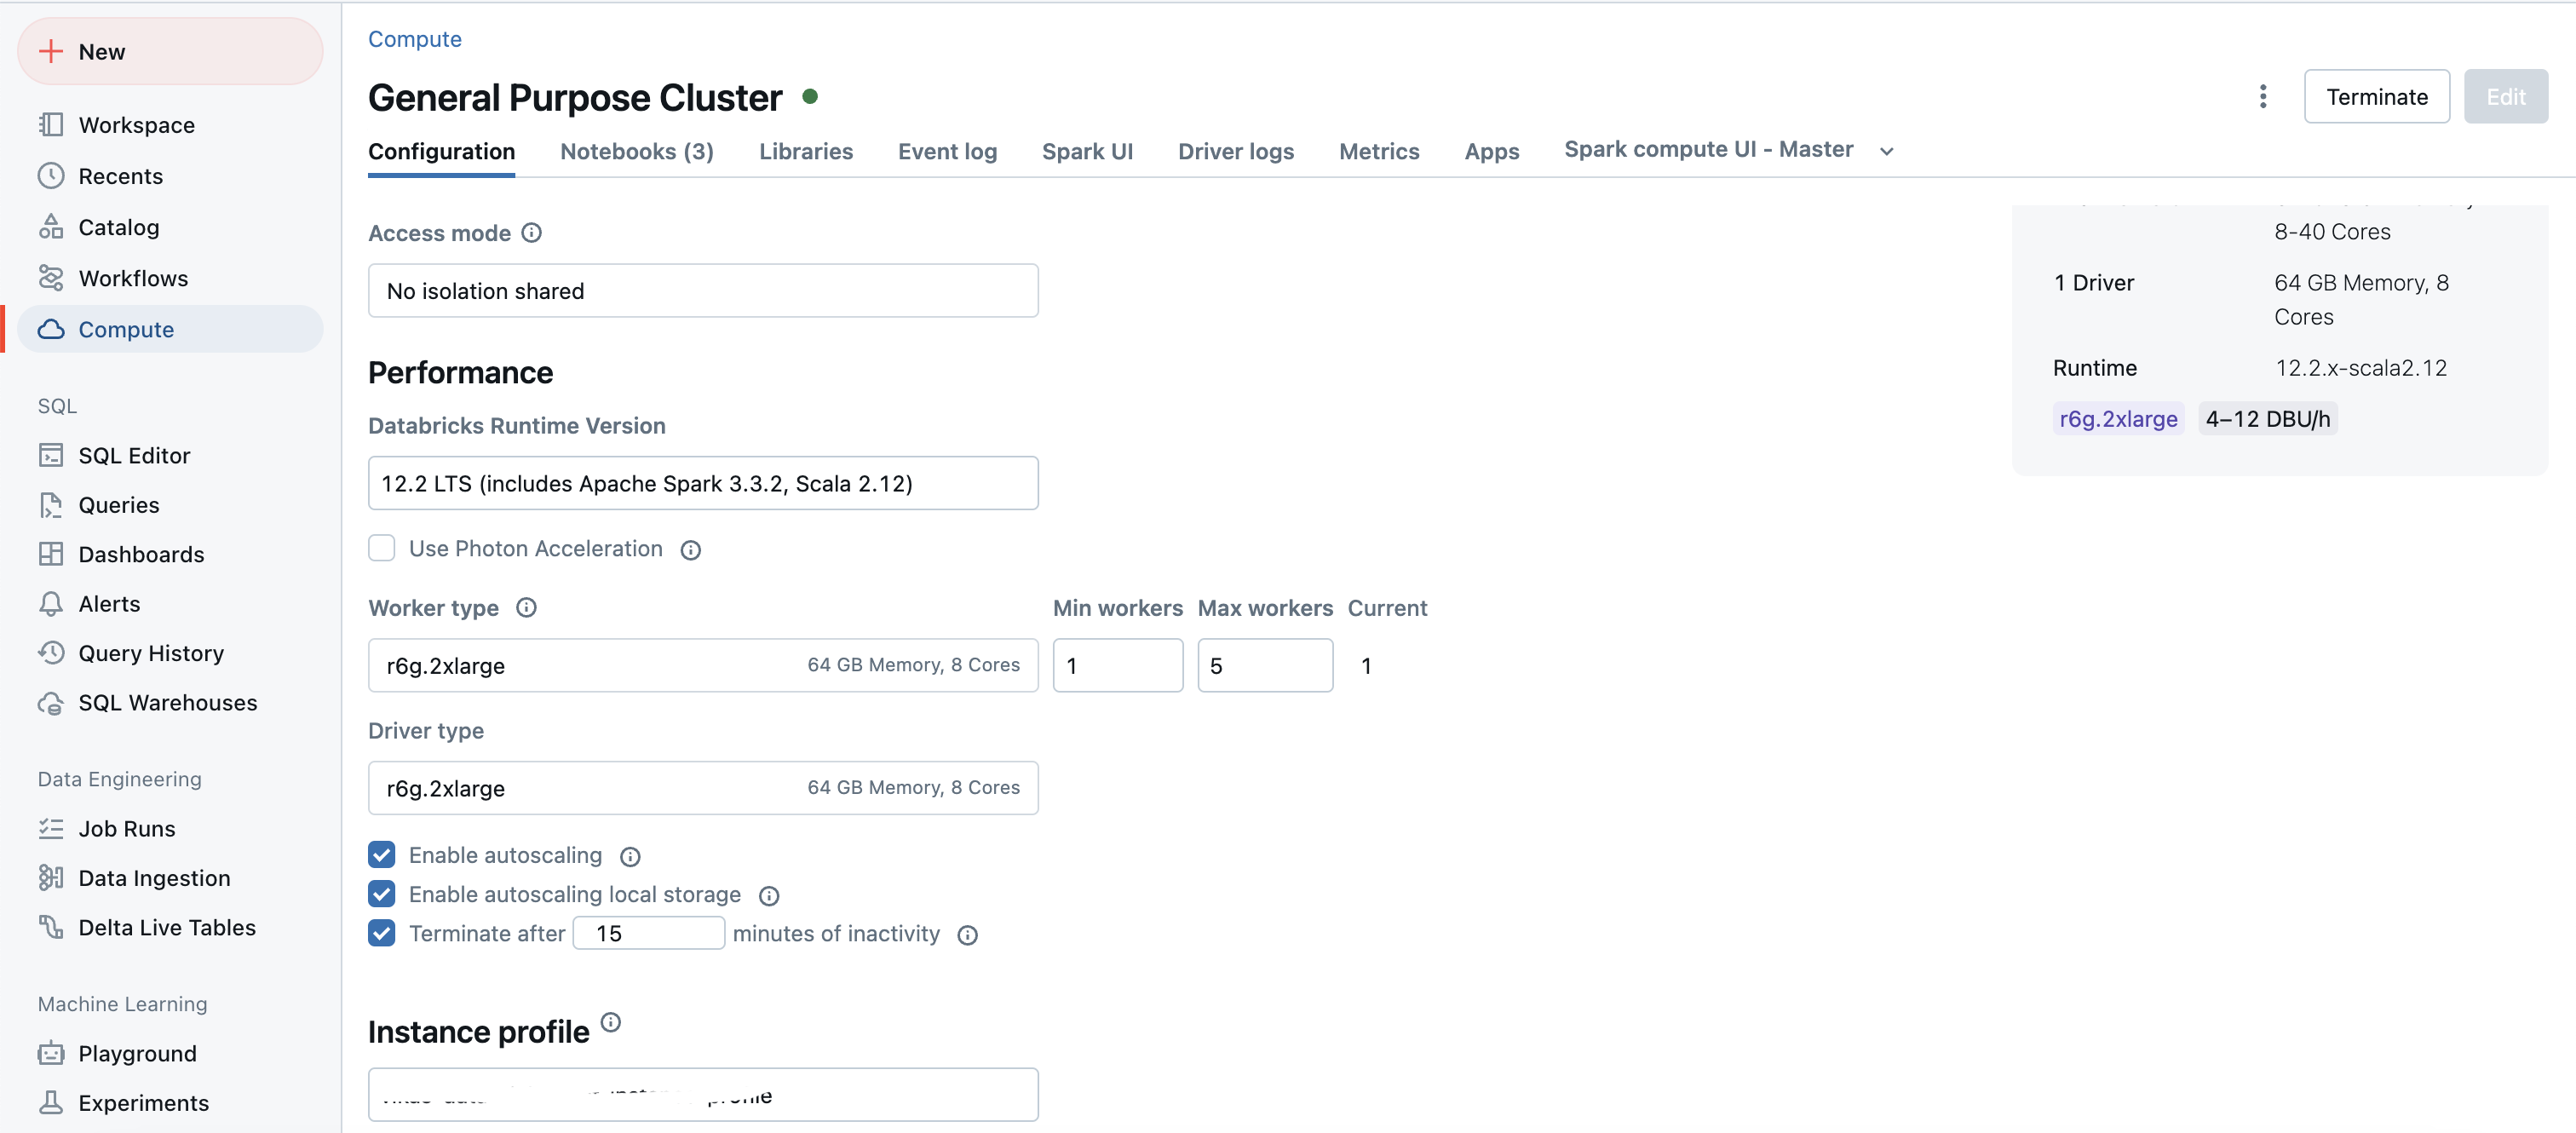
Related snapshots from a real system:
Configs of cluster:
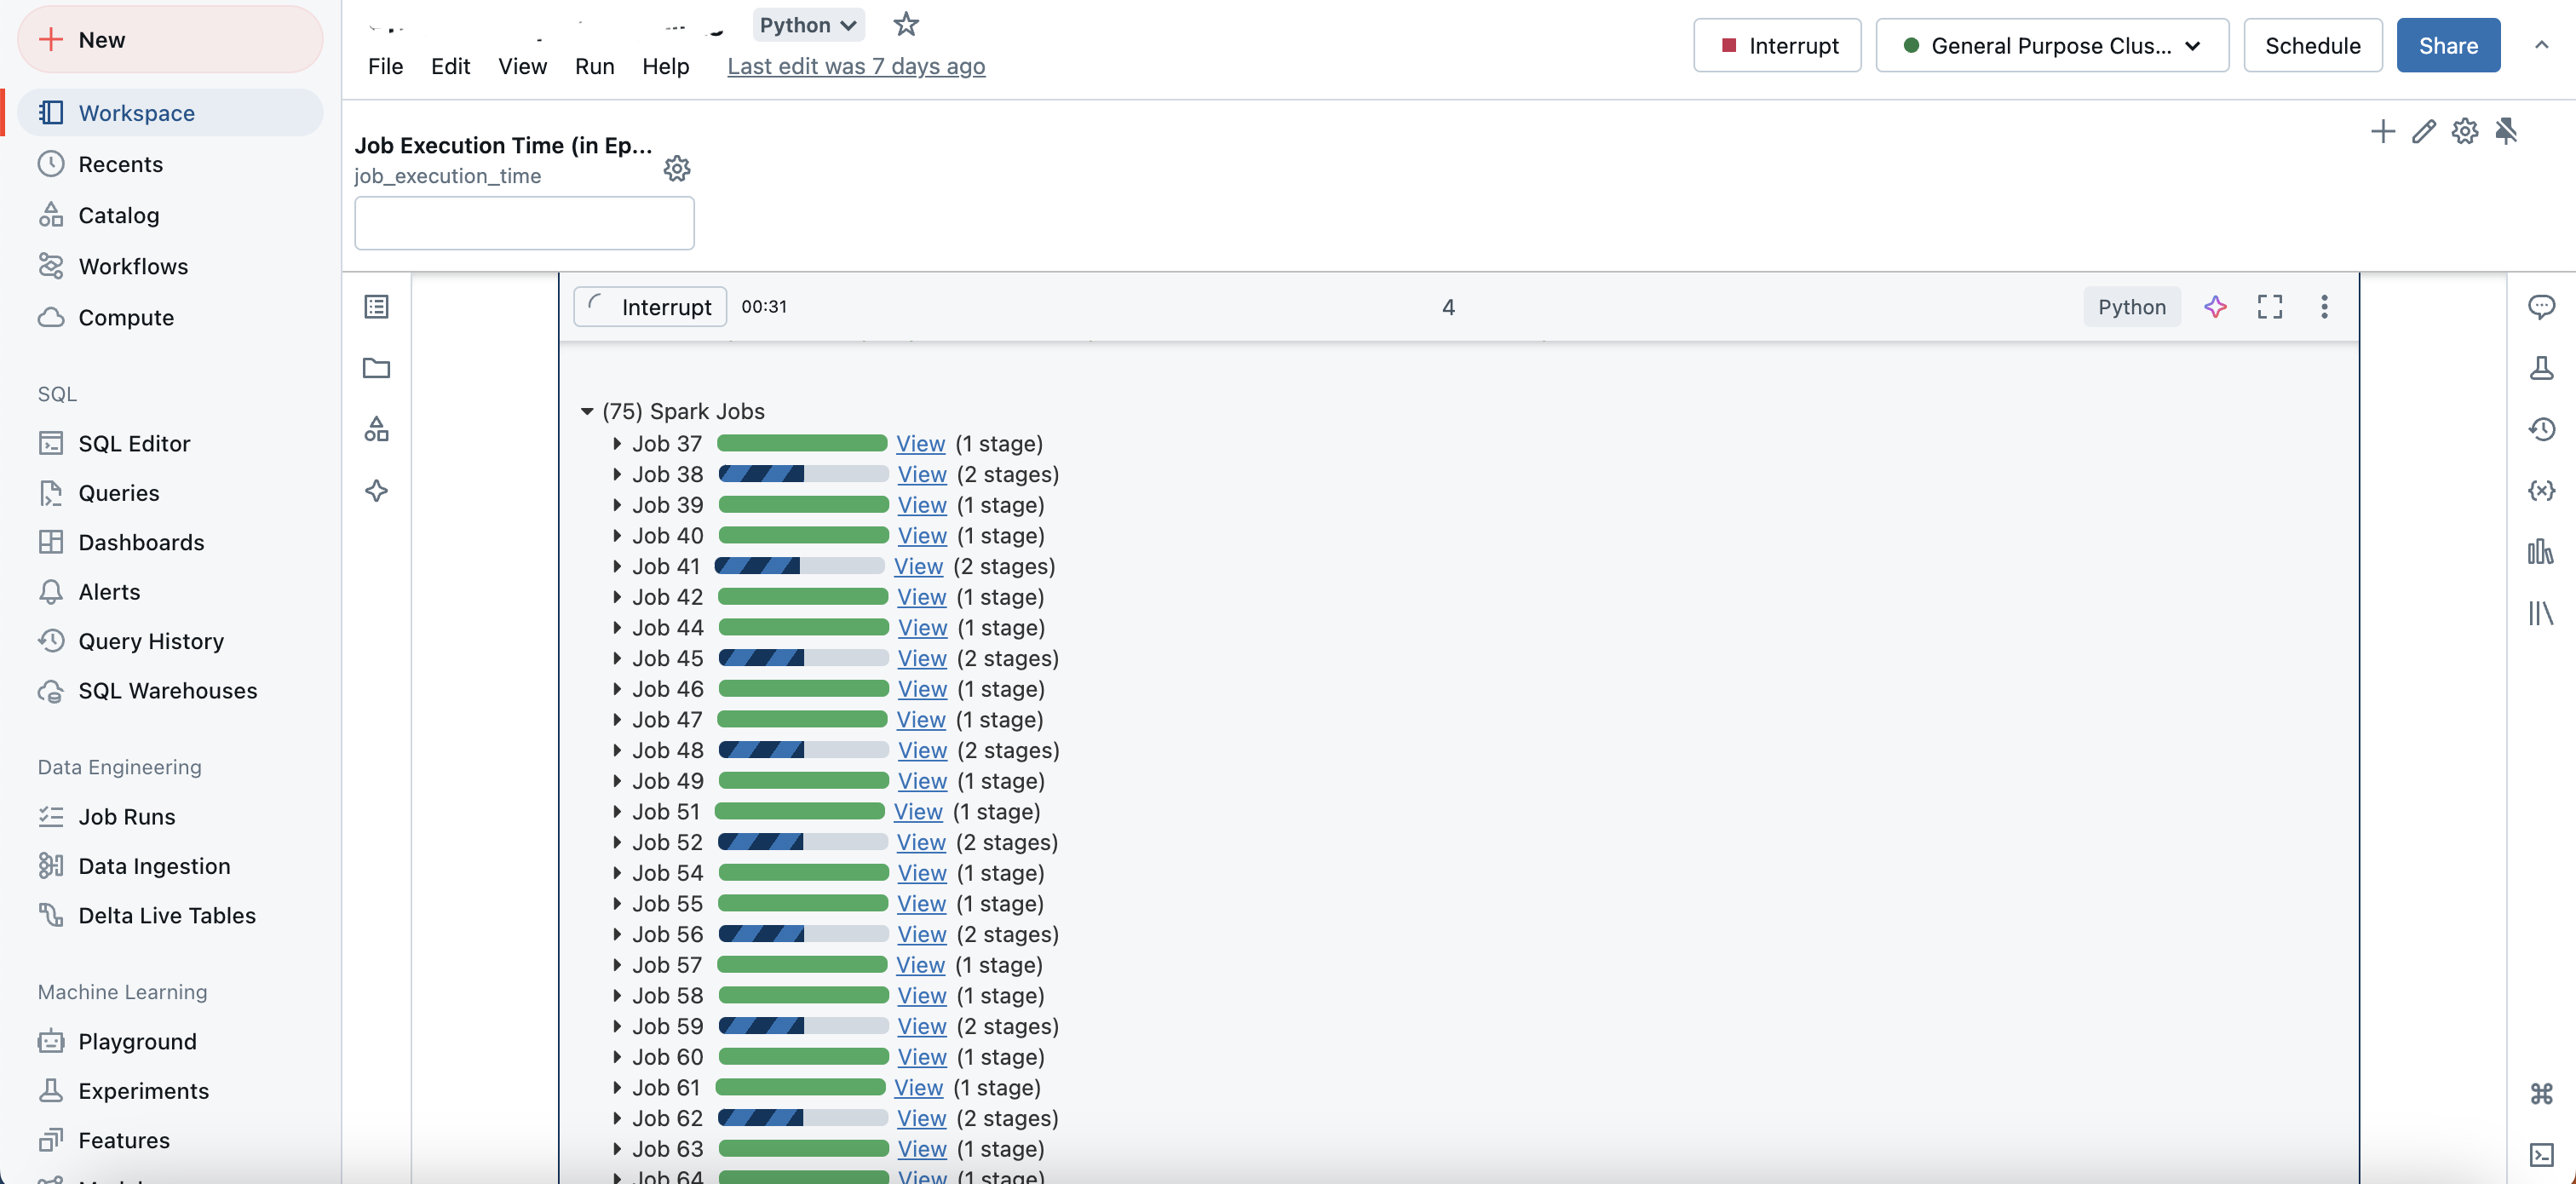
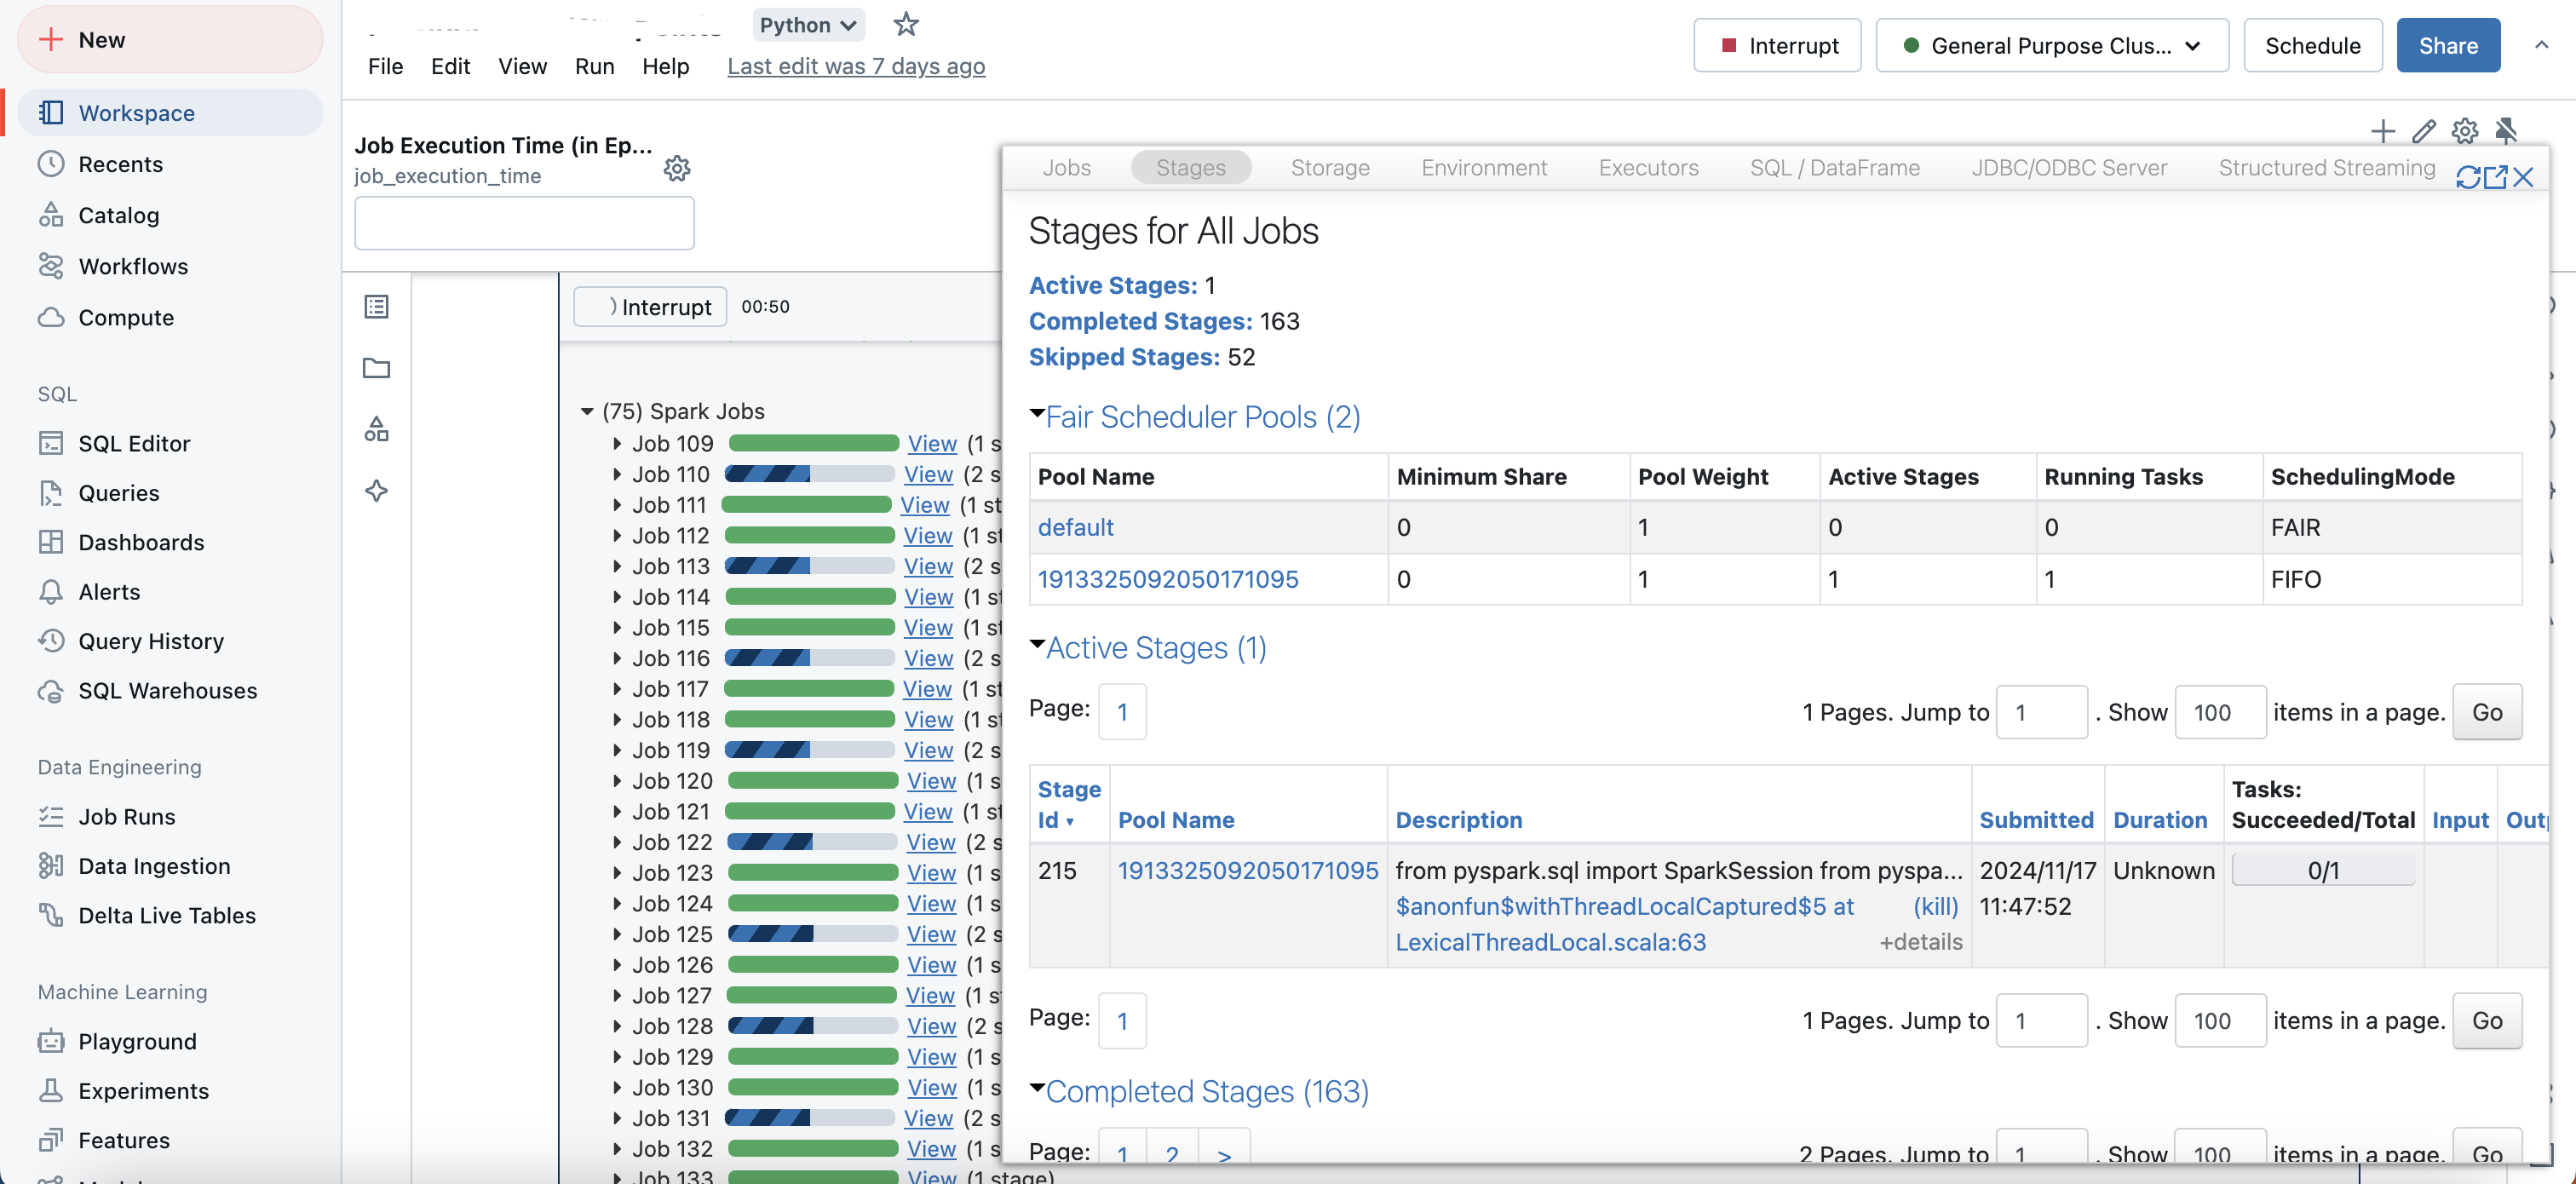
Appearance of jobs when running a spark code:
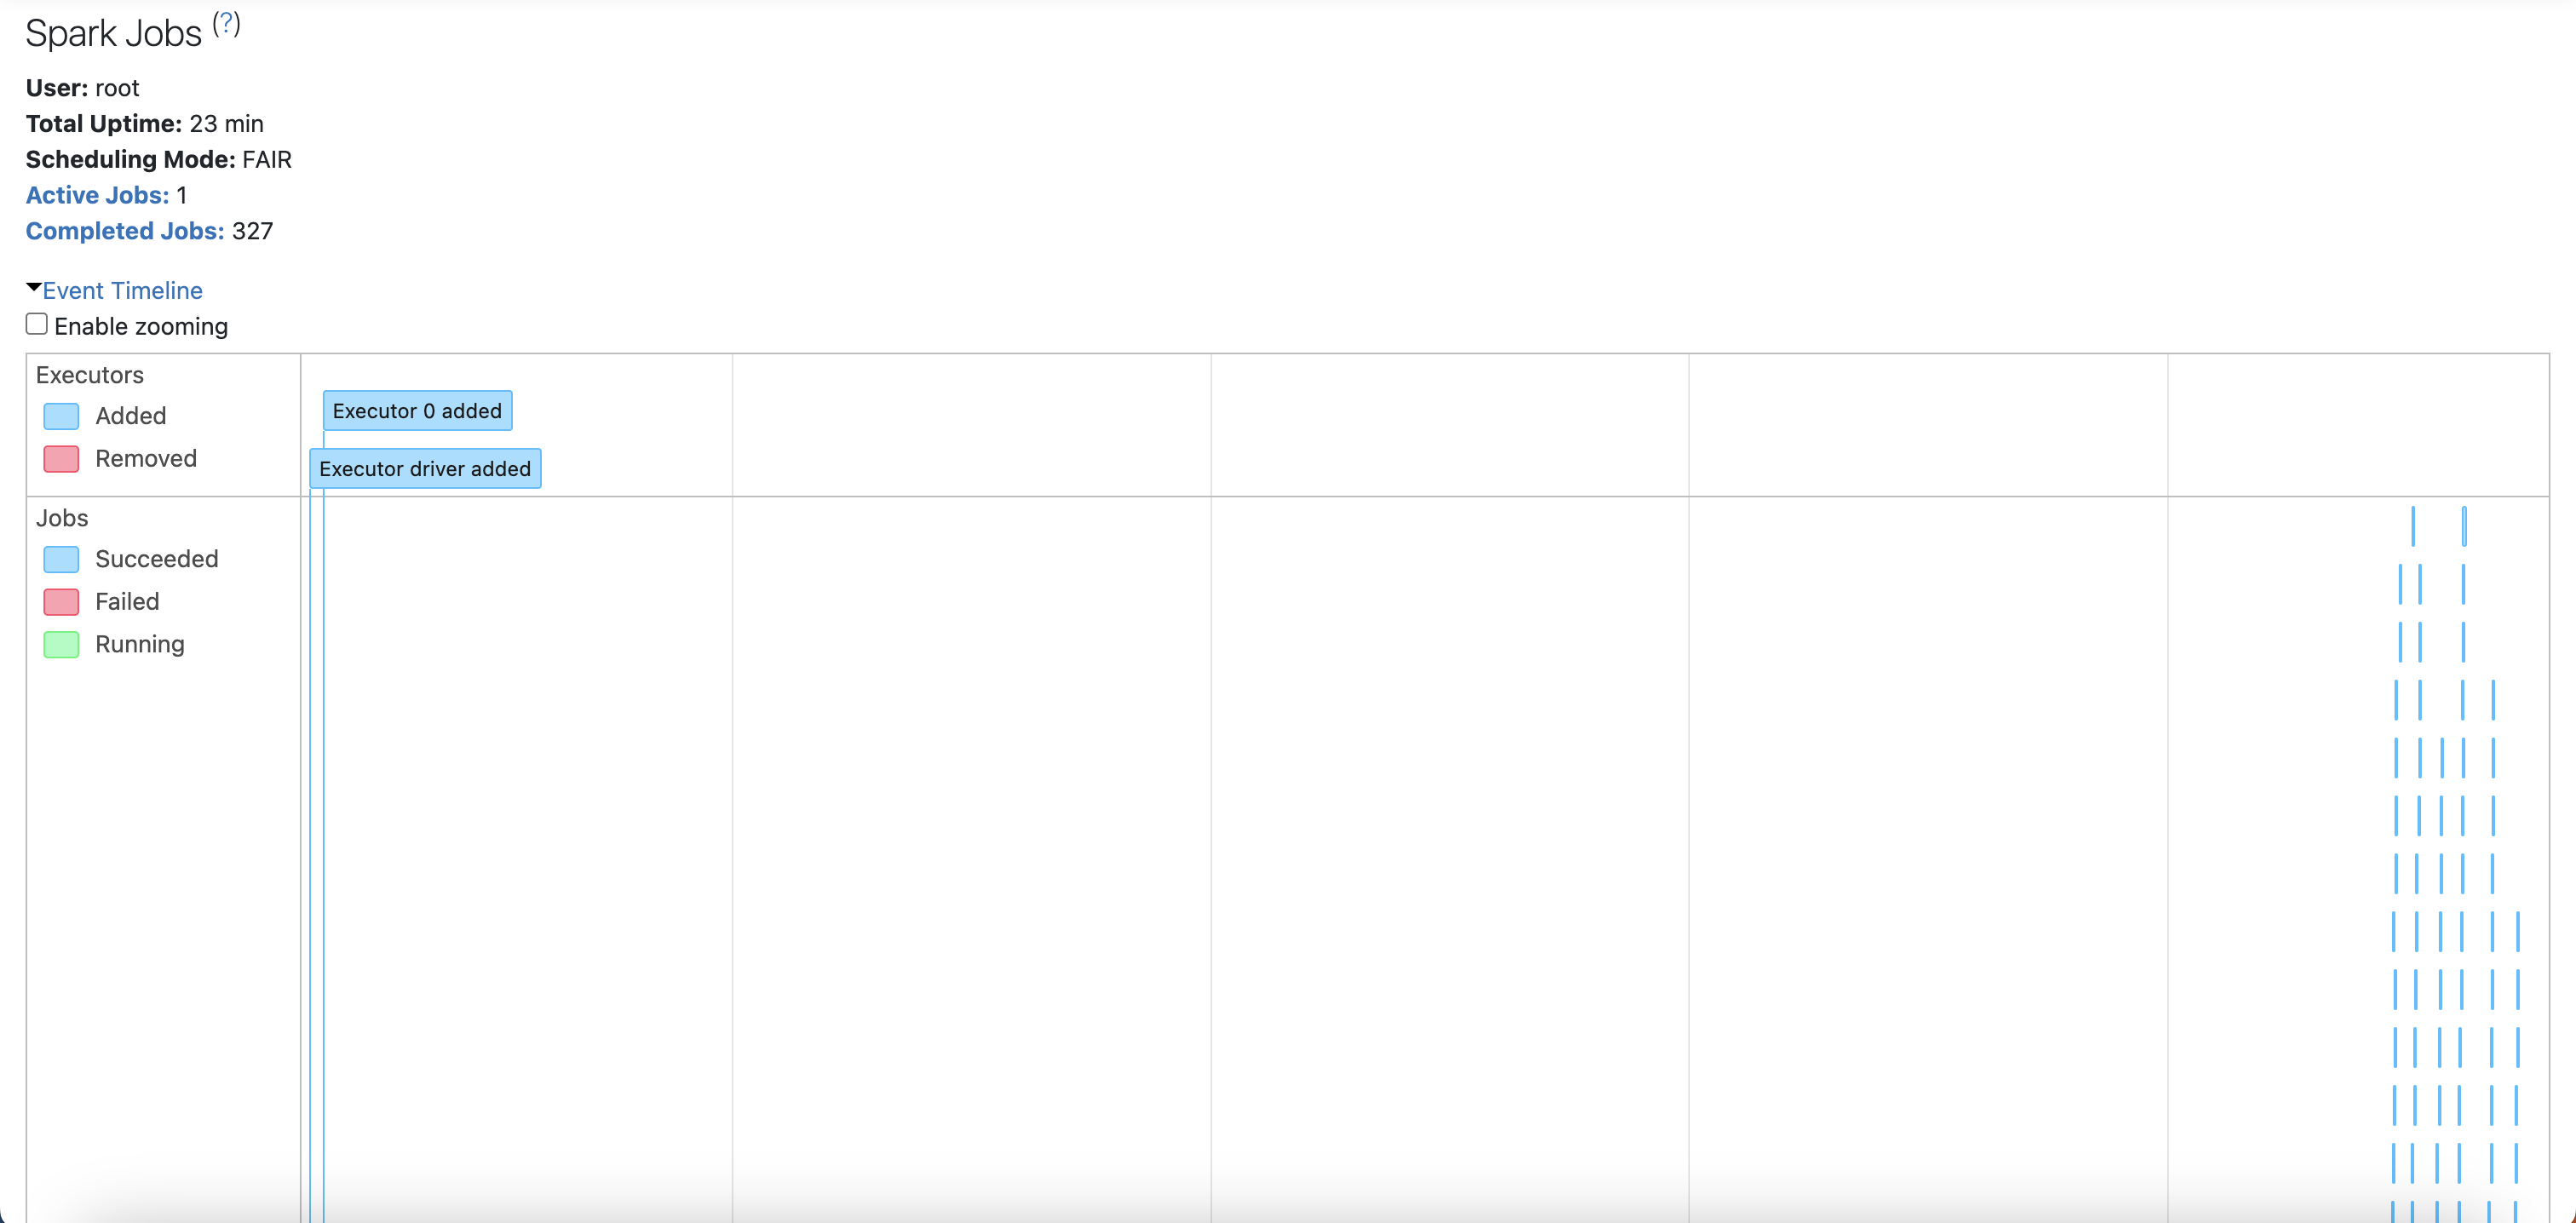
Stages of a Spark job:
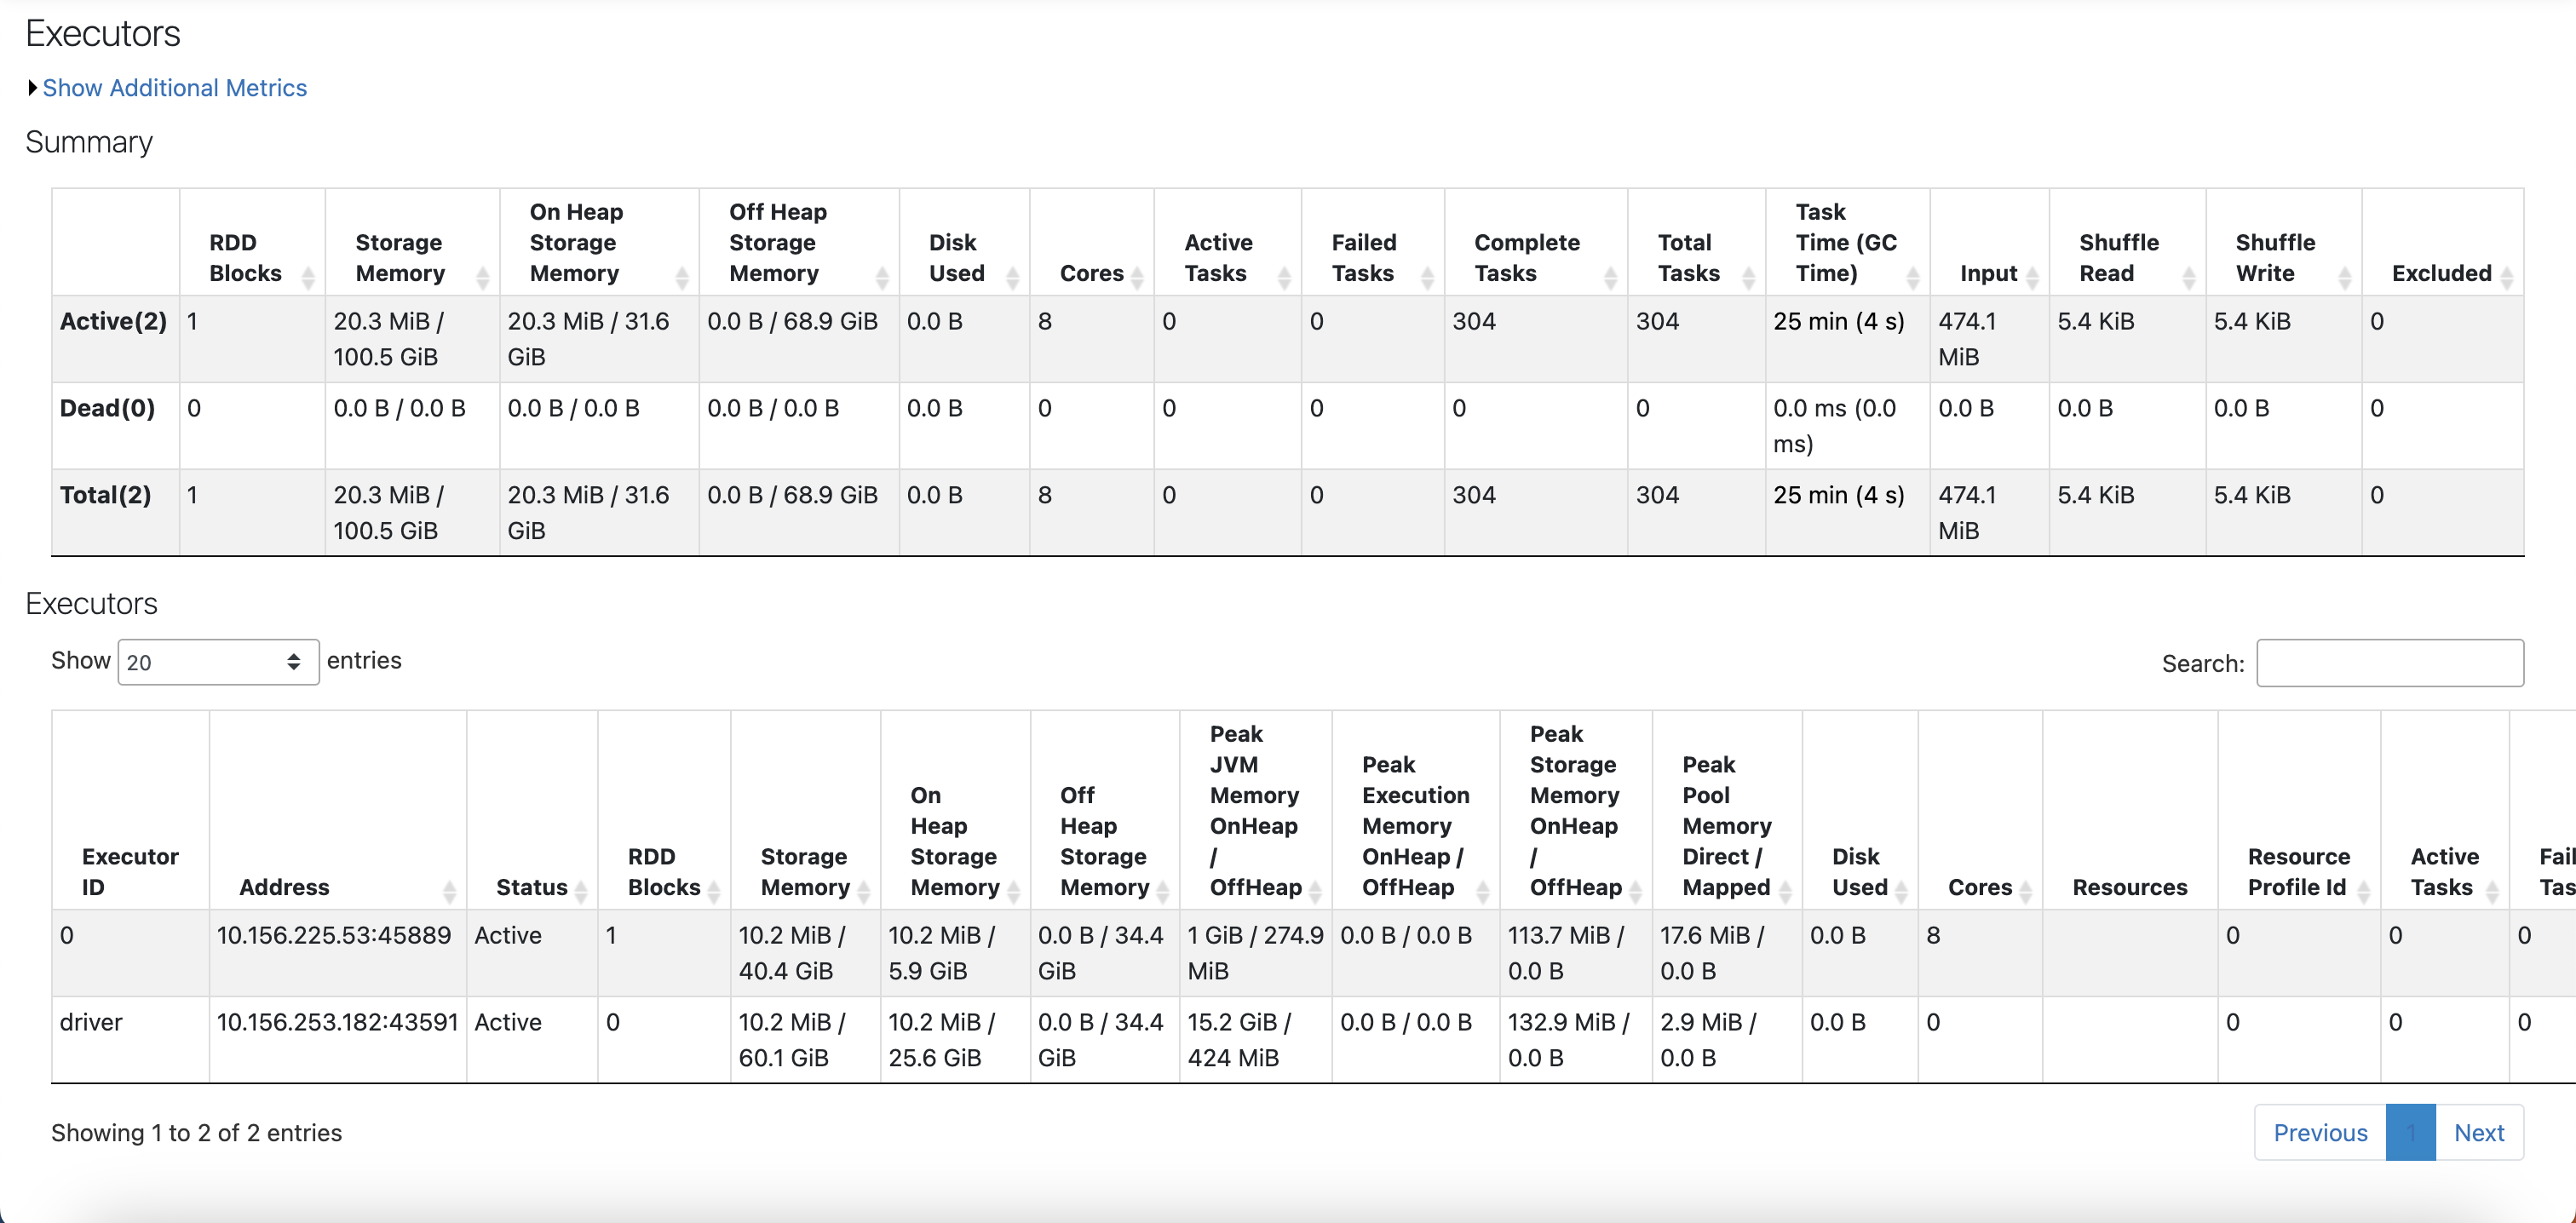
Worker information when running a code:
Cluster Manager: It is responsible for managing resources across the cluster. It allocates resources to different applications and manages their lifecycle. Common cluster managers used with Spark include:
- Standalone Cluster Manager: A simple built-in manager that comes with Spark.
- Apache Mesos: A general-purpose cluster manager that can run Hadoop and other applications alongside Spark.
- Hadoop YARN: A resource management layer for Hadoop that can manage Spark applications.
Data Abstractions:
- Resilient Distributed Datasets (RDDs): RDDs are the fundamental data structure in Spark, representing an immutable distributed collection of objects that can be processed in parallel. RDDs support two types of operations:
- Transformations: Operations that create a new RDD from an existing one (e.g., map, filter).
- Actions: Operations that return a value to the driver or write data to external storage (e.g., count, collect).
- DataFrames and Datasets: DataFrames are a higher-level abstraction built on top of RDDs, providing a structured way to work with data using named columns. Datasets combine the benefits of RDDs and DataFrames, providing type safety while still allowing for optimizations through Catalyst query optimization.
Partitions: A partition is a logical chunk of data that Spark distributes across the cluster. Each partition is processed by a single task, allowing for parallel execution. When Spark reads data from a source (e.g., HDFS), it creates partitions based on the input size and configuration settings. By default, Spark creates one partition for each HDFS block (e.g., typically 128MB).
Execution Flow:
- Job Submission: The user submits a job using spark-submit.
- Driver Initialization: The driver initializes and creates a DAG from user-defined transformations.
- Partition Creation: As data is read from sources, Spark creates partitions based on input size and block size.
- DAG Scheduling: The DAG Scheduler breaks down the job into stages based on transformations and actions.
- Task Scheduling: The Task Scheduler assigns tasks to executors based on available partitions and resources.
- Task Execution: Executors run tasks in parallel across different threads, processing their assigned partitions.
- Data Shuffling: For wide transformations (e.g., groupByKey), data may need to be shuffled between partitions, which can be costly in terms of performance.
- Results Reporting: Executors send results back to the driver upon task completion.
- Example Code Job: Spark job that reads data from a text file, filters lines containing a specific keyword, and counts them:
from pyspark import SparkContext
# Initialize Spark Context
sc = SparkContext("local", "Word Count")
# Read text file into an RDD
lines = sc.textFile("hdfs://path/to/input.txt")
# Check initial number of partitions
print(f"Initial number of partitions: {lines.getNumPartitions()}")
# Filter lines containing 'keyword'
filtered_lines = lines.filter(lambda line: 'keyword' in line)
# Count filtered lines
count = filtered_lines.count()
# Print result
print(f"Number of lines containing 'keyword': {count}")
# Repartitioning example
repartitioned_lines = filtered_lines.repartition(10)
print(f"Number of partitions after repartitioning: {repartitioned_lines.getNumPartitions()}")
# Stop the Spark Context
sc.stop()

Step-by-Step Execution
  Driver Initialization: The SparkContext is created, initializing the driver program.
  RDD Creation: The textFile() method creates an RDD from the input text file, automatically partitioning it based on HDFS blocks (e.g., if the file is large enough).
  Initial Partition Check: The initial number of partitions is printed using getNumPartitions().
  Transformation: The filter() transformation creates a new RDD containing only lines with 'keyword'.
  Action Execution: The count() action triggers execution across the cluster.
  Task Scheduling: The driver divides this job into stages based on transformations, creating tasks for each partition of data.
  Task Execution on Executors: Executors run these tasks in parallel threads, processing their assigned data partitions.
  Repartitioning Example: The repartition(10) method reshuffles the filtered RDD into 10 partitions to demonstrate how you can control partitioning dynamically.
Hardware Level Configuration:
- Cluster Configuration: When running Spark jobs at scale, hardware configuration plays a crucial role:
- Nodes in Cluster: A typical Spark cluster consists of several nodes (machines) configured as follows: Each node can act as either a master (running the driver) or worker (running executors). Worker nodes should have sufficient CPU cores and memory allocated based on workload requirements.
-
Resource Allocation: Each executor runs within its own JVM process on worker nodes. Configuration settings like spark.executor.memory and spark.executor.cores determine how much memory and how many cores each executor will use. Example configuration in spark-defaults.conf:
spark.executor.memory=4g spark.executor.cores=2 - Data Locality: Spark tries to schedule tasks close to where data resides (data locality) to minimize network I/O and improve performance.
- Networking: Adequate network bandwidth is essential for efficient communication between drivers and executors, especially when shuffling data between stages.
- Storage Systems: Integration with distributed storage systems like HDFS or cloud storage solutions (e.g., Amazon S3) allows Spark to read/write large datasets efficiently.
- More details:
Flink
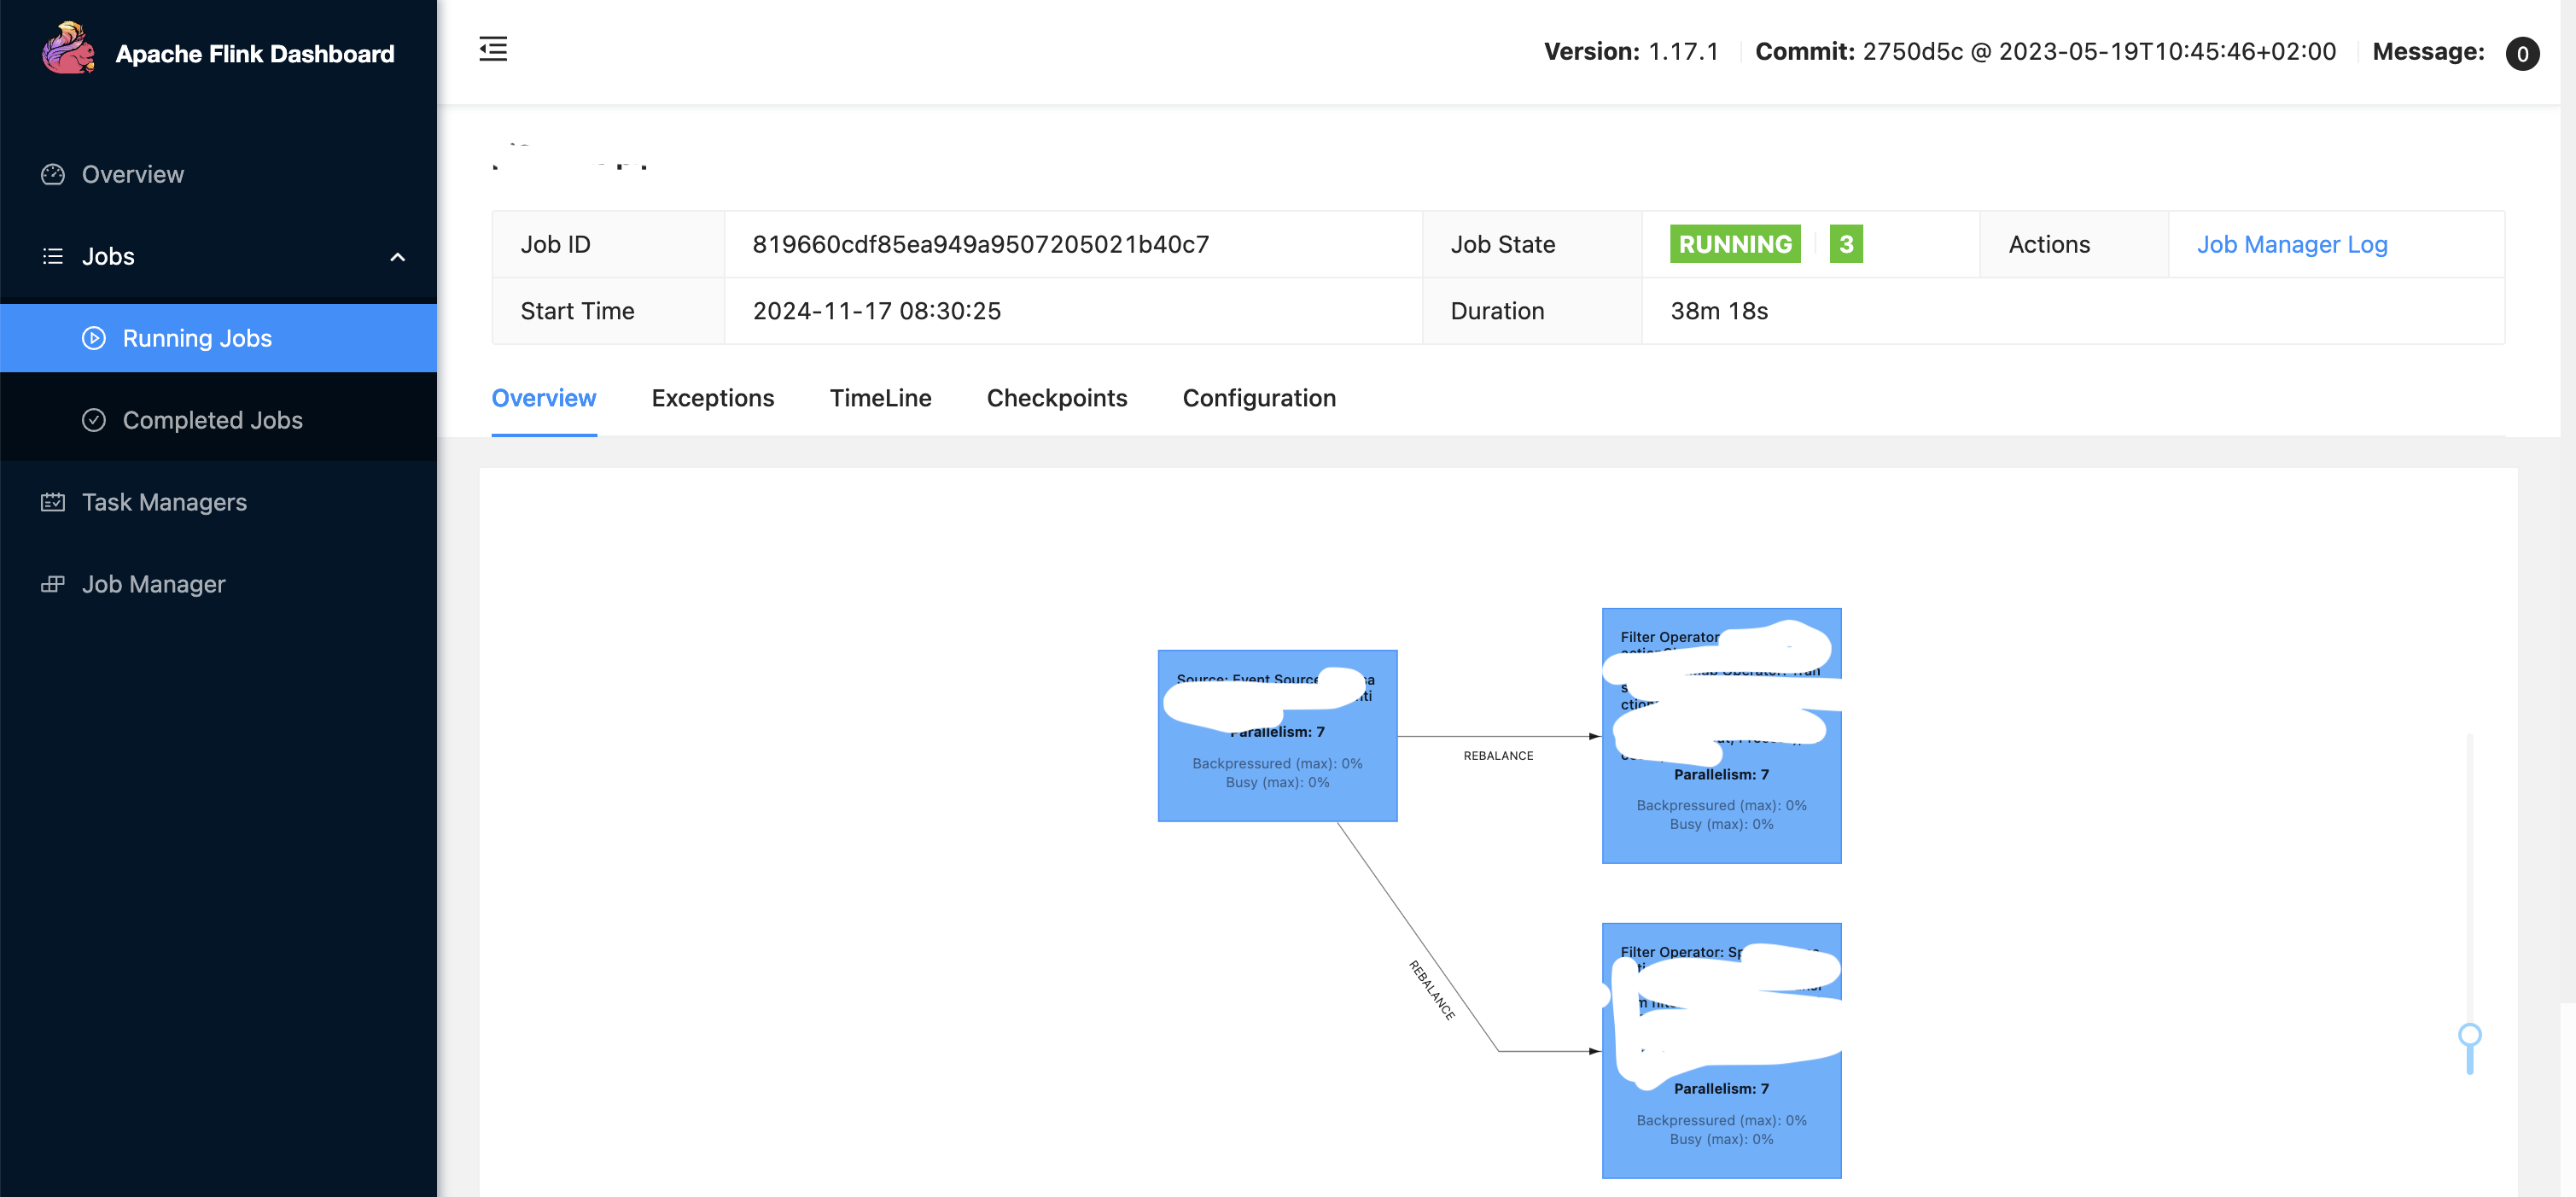
Basic Architecture (More snapshots of actual pipelines below):
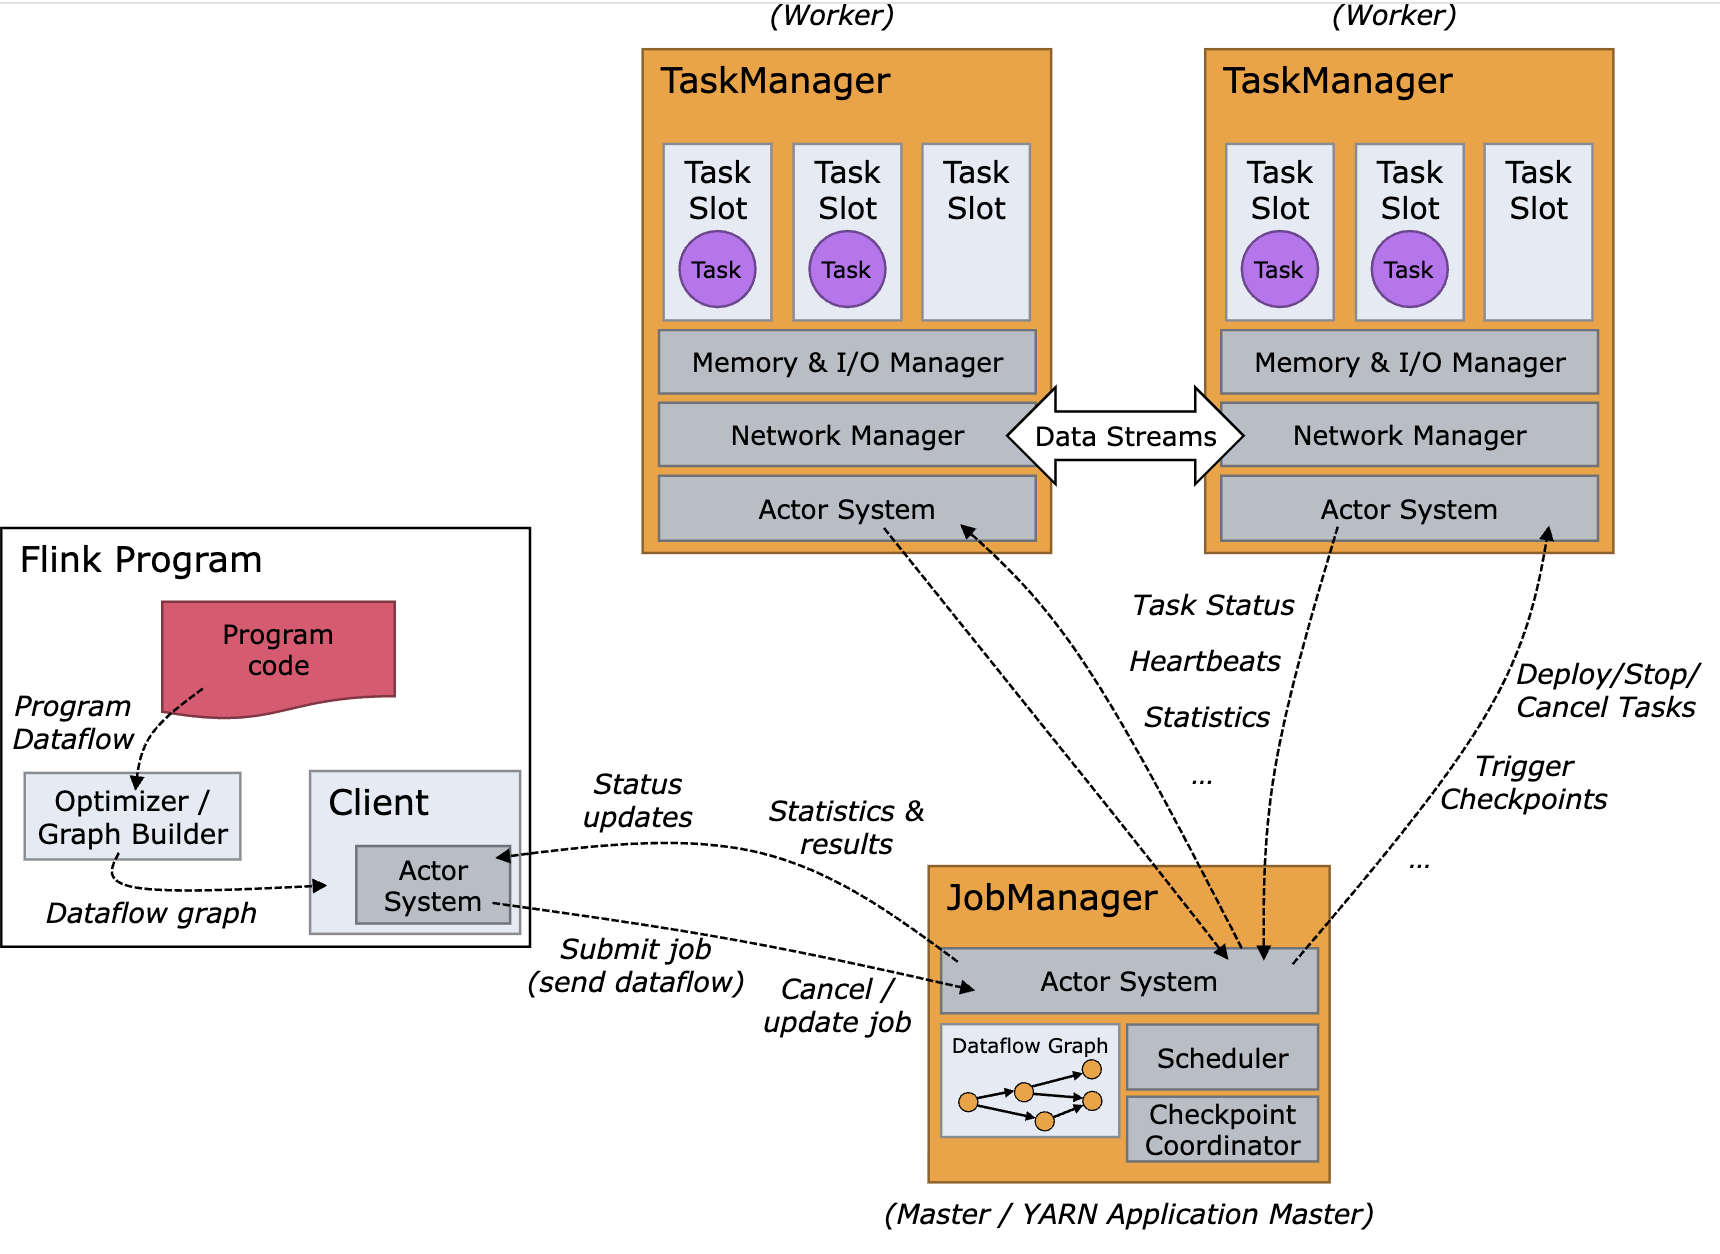 (Image source: ref)
Job Manager: It is the master component responsible for coordinating the execution of jobs. It handles job submission, manages task scheduling and distribution across Task Managers, coordinates checkpoints and recovery in case of failures, and resource management.
- The Job Manager creates a Job Graph from the submitted application and transforms it into a Task Execution Graph for execution.
- In a high-availability (HA) setup, you can have multiple Job Managers. However, only one Job Manager is active at any given time (the leader), while others remain as standby instances. This setup ensures that if the active Job Manager fails, one of the standby instances can take over without disrupting ongoing jobs.
- Flink internally uses the Akka actor system for communication between the Job Managers and the Task Managers.
- An actor system is a container of actors with various roles. It provides services such as scheduling, configuration, logging, and so on. It also contains a thread pool from where all actors are initiated. All actors reside in a hierarchy. Each newly created actor would be assigned to a parent. Actors talk to each other using a messaging system. Each actor has its own mailbox from where it reads all the messages. If the actors are local, the messages are shared through shared memory but if the actors are remote then messages are passed thought RPC calls. Each parent is responsible for the supervision of its children. If any error happens with the children, the parent gets notified. If an actor can solve its own problem then it can restart its children. If it cannot solve the problem then it can escalate the issue to its own parent: In Flink, an actor is a container having state and behavior. An actor’s thread sequentially keeps on processing the messages it will receive in its mailbox. The state and the behavior are determined by the message it has received.
- Useful: ref
- Client: The Client is not part of the runtime but is used to submit jobs to the Job Manager. It can operate in two modes: Attached Mode (Remains connected to receive progress updates), Detached Mode (Disconnects after job submission).
- Task Managers: They are the worker nodes that execute the tasks assigned by the Job Manager. Each Task Manager can run multiple tasks in parallel, depending on the number of task slots it has. Another definition; A Taskmanager (TM) is a JVM process, whereas a Taskslot (TS) is a Thread within the respective JVM process (TM). The managed memory of a TM is equally split up between the TS within a TM. No CPU isolation happens between the slots, just the managed memory is divided. Moreover, TS in the same TM share TCP connections (via multiplexing) and heartbeat messages. They may also share data sets and data structures, thus reducing the per-task overhead. For example, if a Task Manager has four slots then it will allocate 25% of the memory to each slot. There could be one or more threads running in a task slot. Threads in the same slot share the same JVM. Tasks in the same JVM share TCP connections and heart beat messages. You can run multiple Task Managers on a single machine or across multiple machines. The number of Task Managers you can effectively run on a single server depends on the available resources (CPU, memory) and the workload’s resource requirements. A task slot is basically a thread pool.
- A task in Flink is an execution unit that represents a single operator or a chain of operators (subtasks) that can process data concurrently (more details on operators discussed later). The idea of slots is to slice the available resources up into smaller parts. The available managed memory is evenly distributed among all slots. CPU cycles and JVM heap memory are not properly isolated w.r.t slots. In each slot you can deploy one or more Tasks. A Flink Task is executed by a dedicated thread. Thus, you can have multiple threads running in the same slot if you have multiple Tasks deployed to it.
- A Task represents a parallel instance of a single Flink operator or of multiple operators if they are chainable. Chaining is not always possible or desired but if applied, it will fuse operators so that they are executed by the same Task thread. This is usually more efficient since there are fewer context switches and no handing over of records to a different thread.
- In order to improve resource utilization (especially for Tasks which need little resources) and to make the reasoning about how many slots you need to run a Flink program easier, Flink supports slot sharing. Slot sharing means that parallel instances of different operators can be deployed to the same slot. Due to this feature, Flink creates as long pipelines of different operators as possible and deploys them to the same slot.
- Flink by default chains operators if this is possible. Chained operators run in the same thread while others run on different threads. Task chaining/Operator chaining brings one or more tasks into a single thread which reduces the impact of the de/serialization of the records that travel around your streaming flow. You can turn off chaining of operators using functions like, disableChaining(), so thread co-location will not be used as an optimization. But it may cause performance impact as there would be an extra overhead of serialization and de-serialization of data moving across different operators running on threads.
- Disabling operator chaining can be useful for debugging or demos, because it makes the communication between operators more observable. It might be useful in production if you have an operator that you need to isolate because it uses a library that isn’t thread-safe – but then you’d also need to disable slot sharing.
- Operators in Flink:
- Flink processes data through operators, which are functions that transform input data streams into output streams. Operators are chained together to form tasks, optimising performance by reducing overhead. Operators are classes perform transformations on the incoming data streams, allowing for complex event processing. They can transform, filter, aggregate, or perform other operations on data streams. Each operator can run in parallel across multiple instances depending on the configured parallelism.
- Types of Operators:
- Source Operators: Read data from external systems (e.g., Kafka).
- Transformation Operators: Modify or filter the data (e.g., map, filter, process).
- Sink Operators: Write data to external systems (e.g., databases, message queues).
- Eg: SingleOutputStreamOperator is used to represent a transformation that produces one output stream. This is commonly used when applying functions like map or filter to a DataStream.
- Types of Operators:
-
Example code snippet: Here’s a simple example using Flink’s DataStream API to count words from a socket stream:
// java import org.apache.flink.api.common.functions.FlatMapFunction; import org.apache.flink.streaming.api.datastream.DataStream; import org.apache.flink.streaming.api.environment.StreamExecutionEnvironment; import org.apache.flink.util.Collector; public class SocketTextStreamWordCount { public static void main(String[] args) throws Exception { final StreamExecutionEnvironment env = StreamExecutionEnvironment.getExecutionEnvironment(); DataStream<String> text = env.socketTextStream("localhost", 9999); DataStream<Tuple2<String, Integer>> counts = text .flatMap(new LineSplitter()) .keyBy(value -> value.f0) .sum(1); counts.print(); env.execute("Socket Text Stream WordCount"); } public static final class LineSplitter implements FlatMapFunction<String, Tuple2<String, Integer>> { @Override public void flatMap(String value, Collector<Tuple2<String, Integer>> out) { String[] tokens = value.toLowerCase().split("\\W+"); for (String token : tokens) { if (token.length() > 0) { out.collect(new Tuple2<>(token, 1)); } } } } } /* In this example: A socket stream is created from port 9999. The LineSplitter operator splits lines into words and emits them as tuples. The stream is keyed by word and summed to count occurrences. */ - Useful: ref
- Flink processes data through operators, which are functions that transform input data streams into output streams. Operators are chained together to form tasks, optimising performance by reducing overhead. Operators are classes perform transformations on the incoming data streams, allowing for complex event processing. They can transform, filter, aggregate, or perform other operations on data streams. Each operator can run in parallel across multiple instances depending on the configured parallelism.
- Parallelism in Flink: The parallelism of a task can be specified in Flink on different levels.
-
Operator Level: The parallelism of an individual operator, data source, or data sink can be defined by calling its setParallelism() method. Eg:
private SingleOutputStreamOperator<JsonNode> filter(DataStream<JsonNode> stream) { return stream.process(new SplitPayTransactionChargedEventFilter()) .name(NU_SPLITPAY_TRANSACTION_CHARGED_EVENT_STREAM_FILTER).setParallelism(10); } -
Execution Environment Level: An execution environment defines a default parallelism for all operators, data sources, and data sinks it executes. Execution environment parallelism can be overwritten by explicitly configuring the parallelism of an operator. Eg:
final StreamExecutionEnvironment env = StreamExecutionEnvironment.getExecutionEnvironment(); env.setParallelism(Integer.valueOf(parameterTool.get("PIPELINE_PARALLELISM"))); - When calling setParallelism on an operator, then it changes the parallelism of this specific operator. Consequently, you can set for each operator a different parallelism. However, be aware that operators with different parallelism cannot be chained and entail a rebalance (similar to a shuffle) operation. If you want to set the parallelism for all operators, then you have to do it via the ExecutionEnvironment#setParallelism API call.
- Useful: ref, ref2
-
- If we deploy flink on EKS clusters, you can define in the deployment yaml config the parallelism you want to set. Some cases:
- Case 1:
- In eks config: taskmanager.numberOfTaskSlots: “13” and job: parallelism: 7
- In application code env.setParallelism() at global level: Not set
- Say you use 3 operators - total parallelism would be 7*3 -> 21.
- Total task managers created by flink would be: 7/13 = 1. Least number of task managers to spin up is 1.
- Number of task managers spinned up in a flink pipeline = Parallelism / Total task slots.
- Case 2:
- In eks config: taskmanager.numberOfTaskSlots: “2” and job: parallelism: 8
- In application code env.setParallelism() at global level: Not set
- Total task managers formed would be 8/2 = 4.
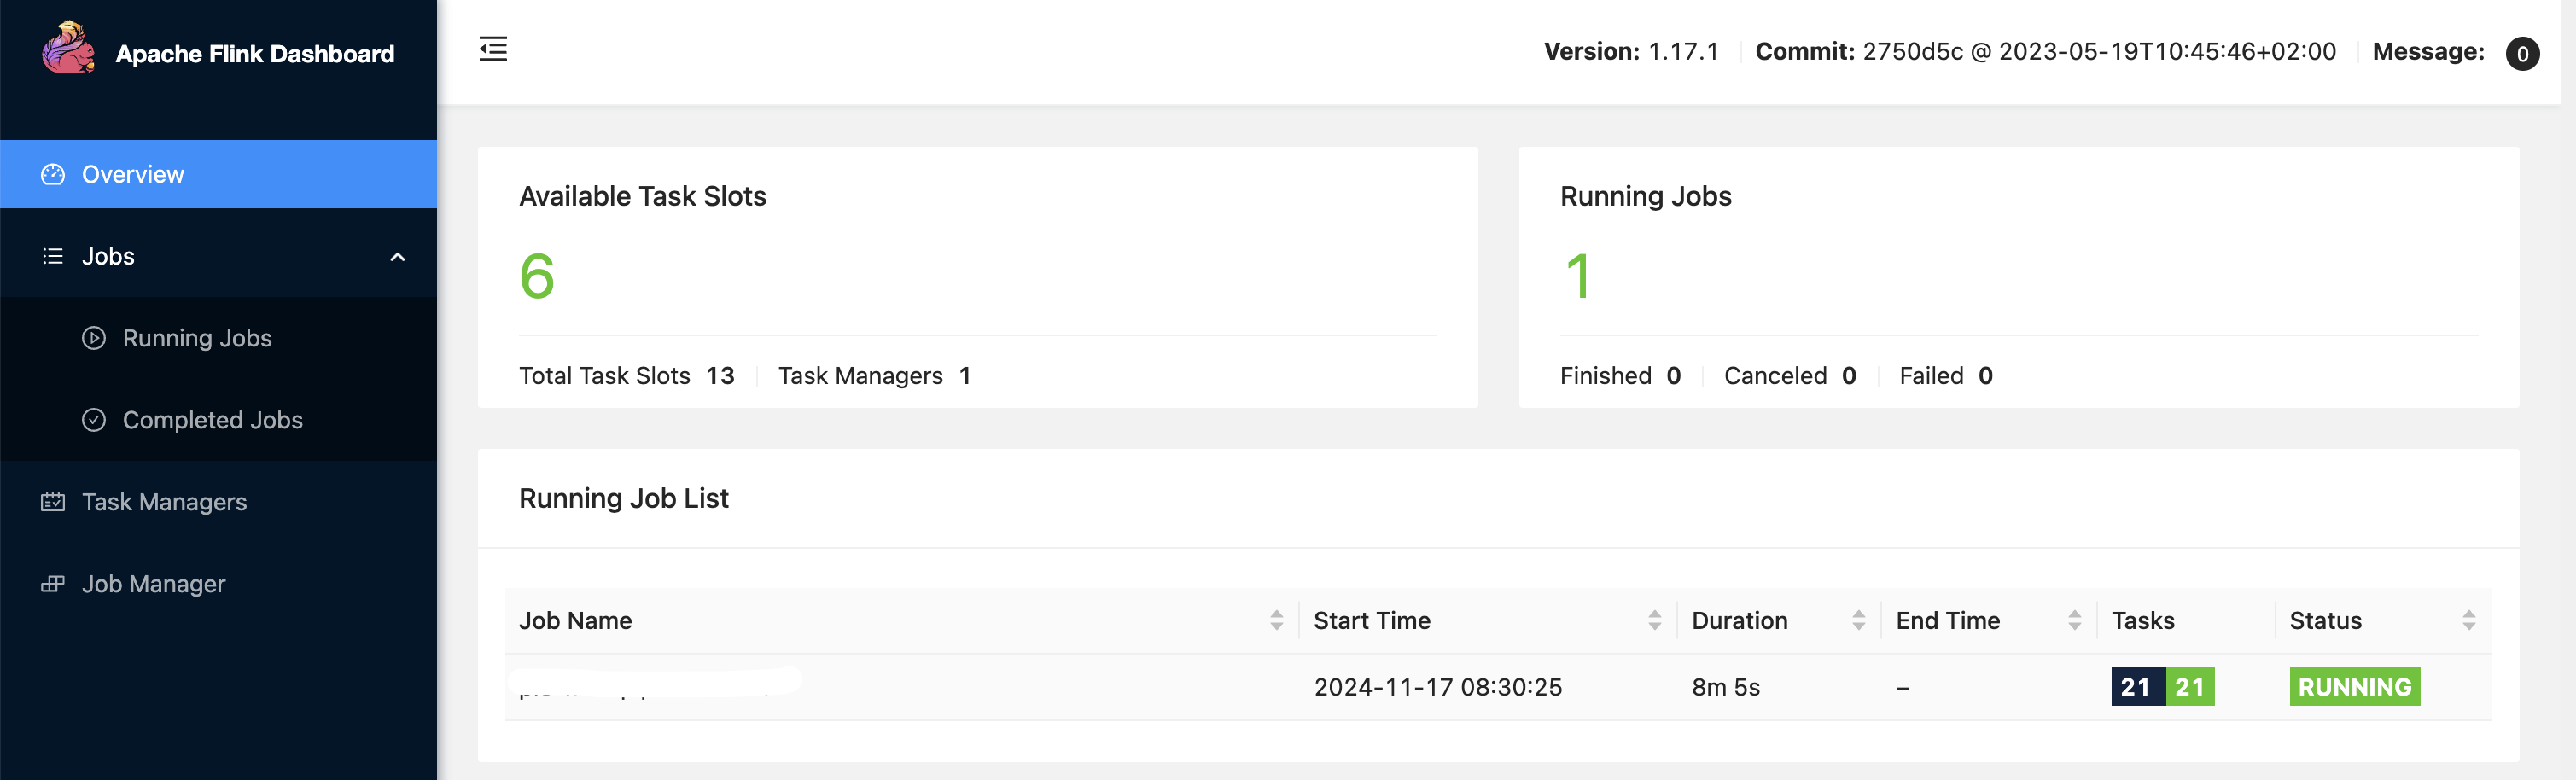
- Understand that, parallelism is a slightly complex concept in Flink, to make things easy we are only considering global level parallelism in our use cases.
- Case 3:
- In eks config: taskmanager.numberOfTaskSlots: “13” and job: parallelism: 7
- In application code env.setParallelism() at global level: 91
- Observe, global level parallelism is 91. It picks up parallelism defined here rather than the eks config which is 7 and applies to all 3 operators as you see, it takes precedence. Similarly, task slots is 13, and since parallelism is 91, total task managers spawned up would be 91/13 ~ 7. So 7 task managers each having 13 task slots contribute to the overall defined parallelism of 91. There are total 273 tasks running because, 3 operators each with parallelism 91 ~ 91*3 = 273. It means, inside 1 task slot, 3 tasks are running - so each operator is running 1 task (we have 3 operators in action as seen).
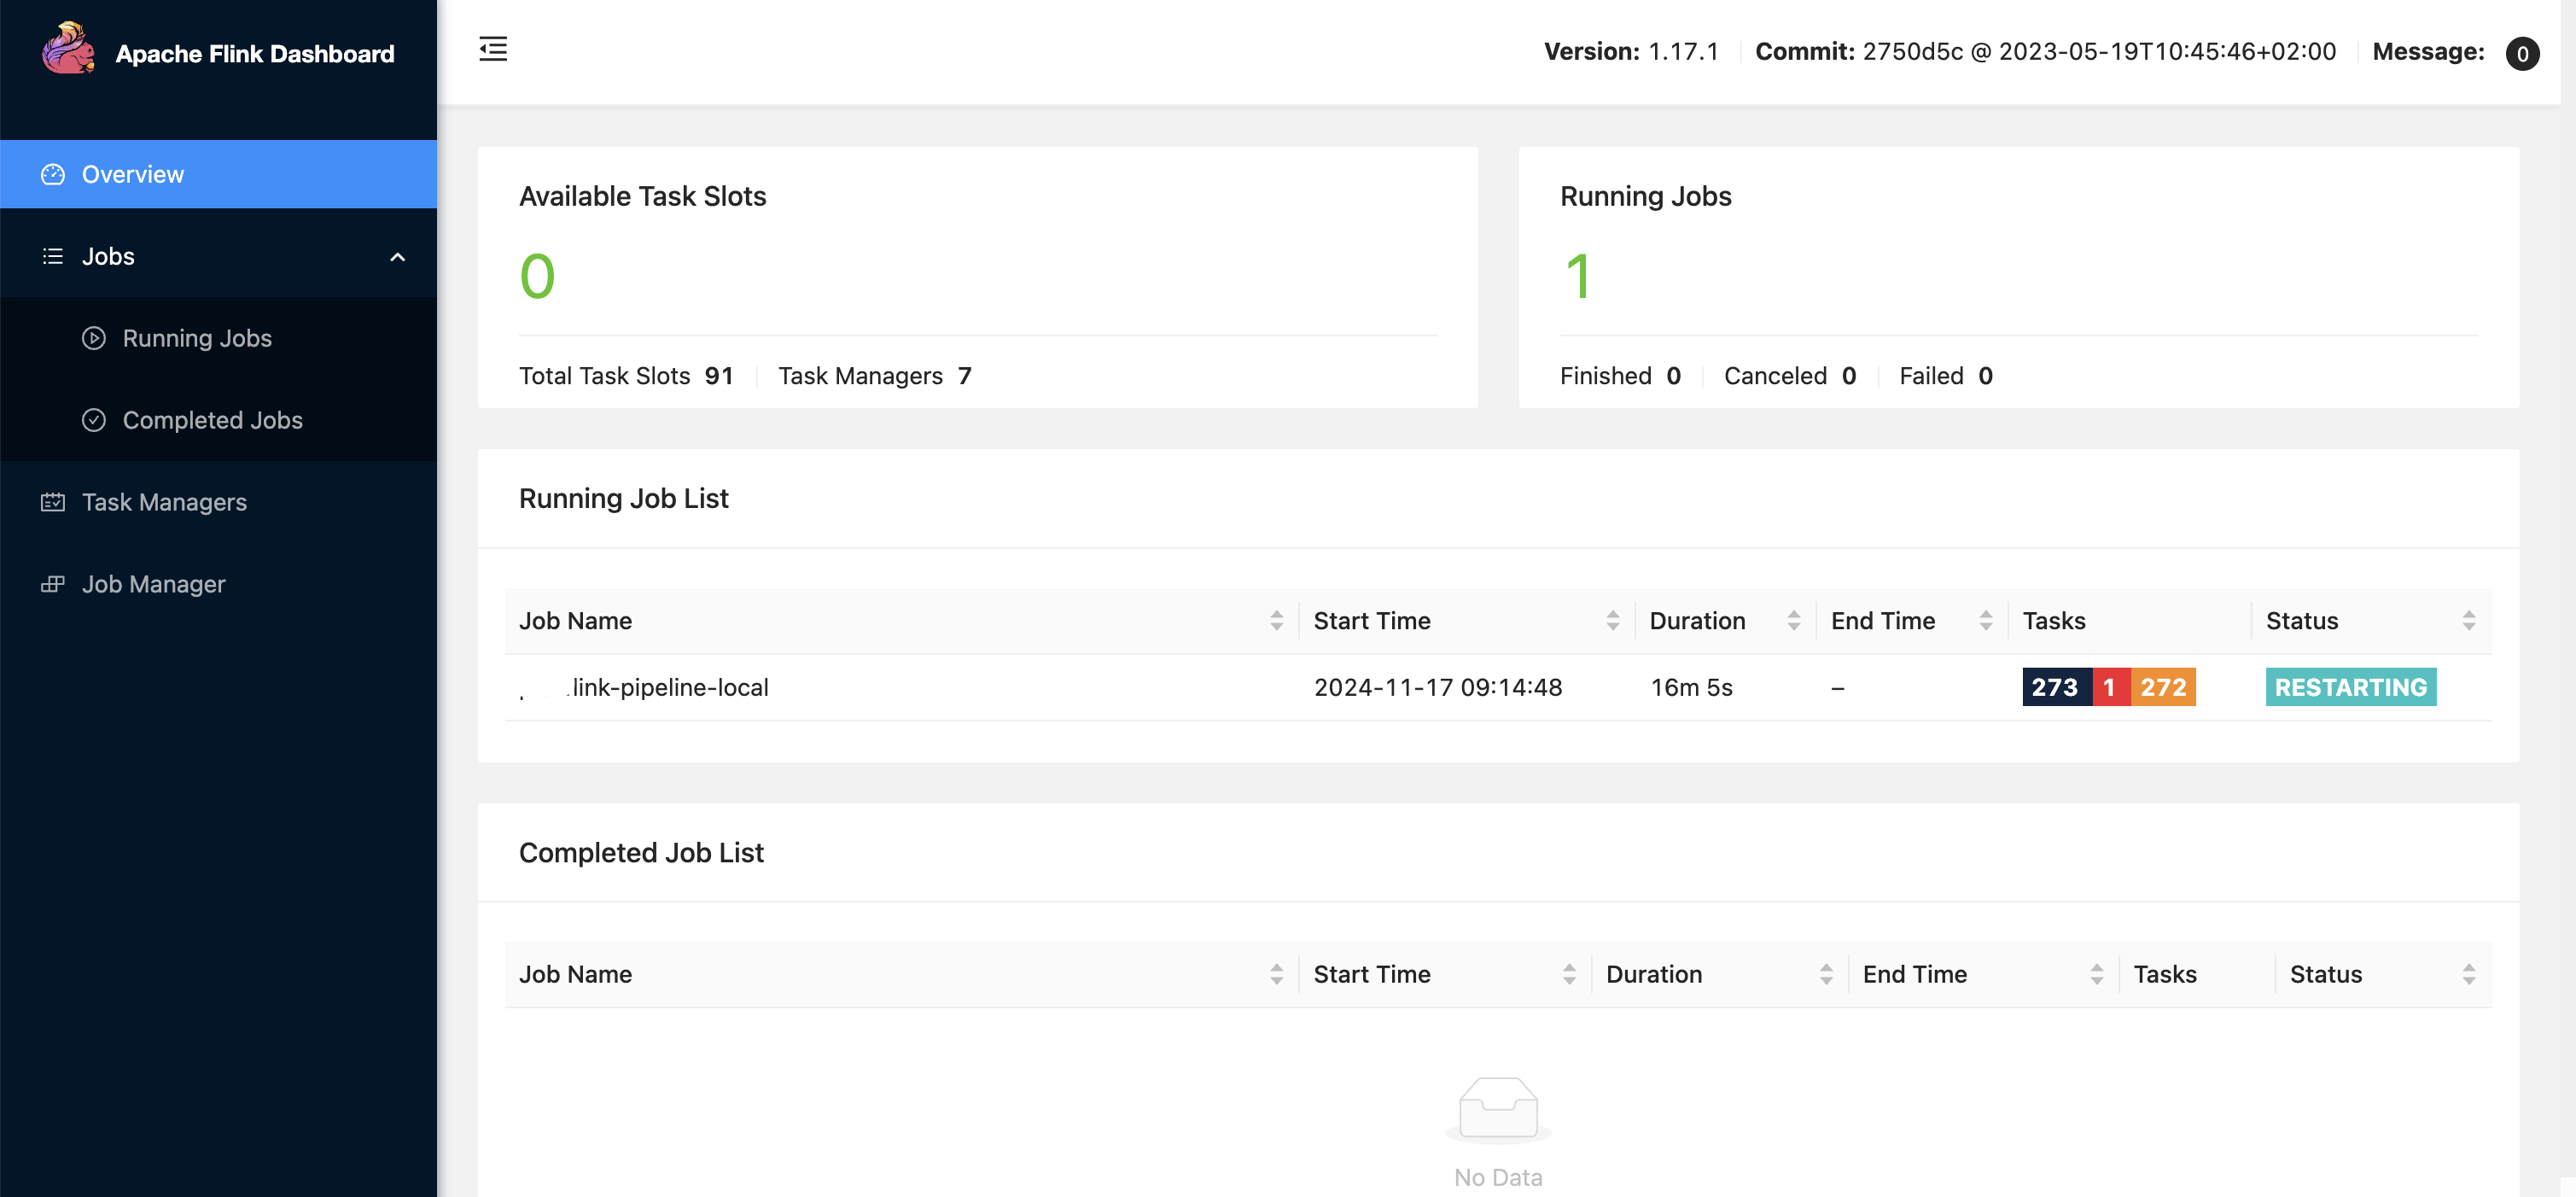
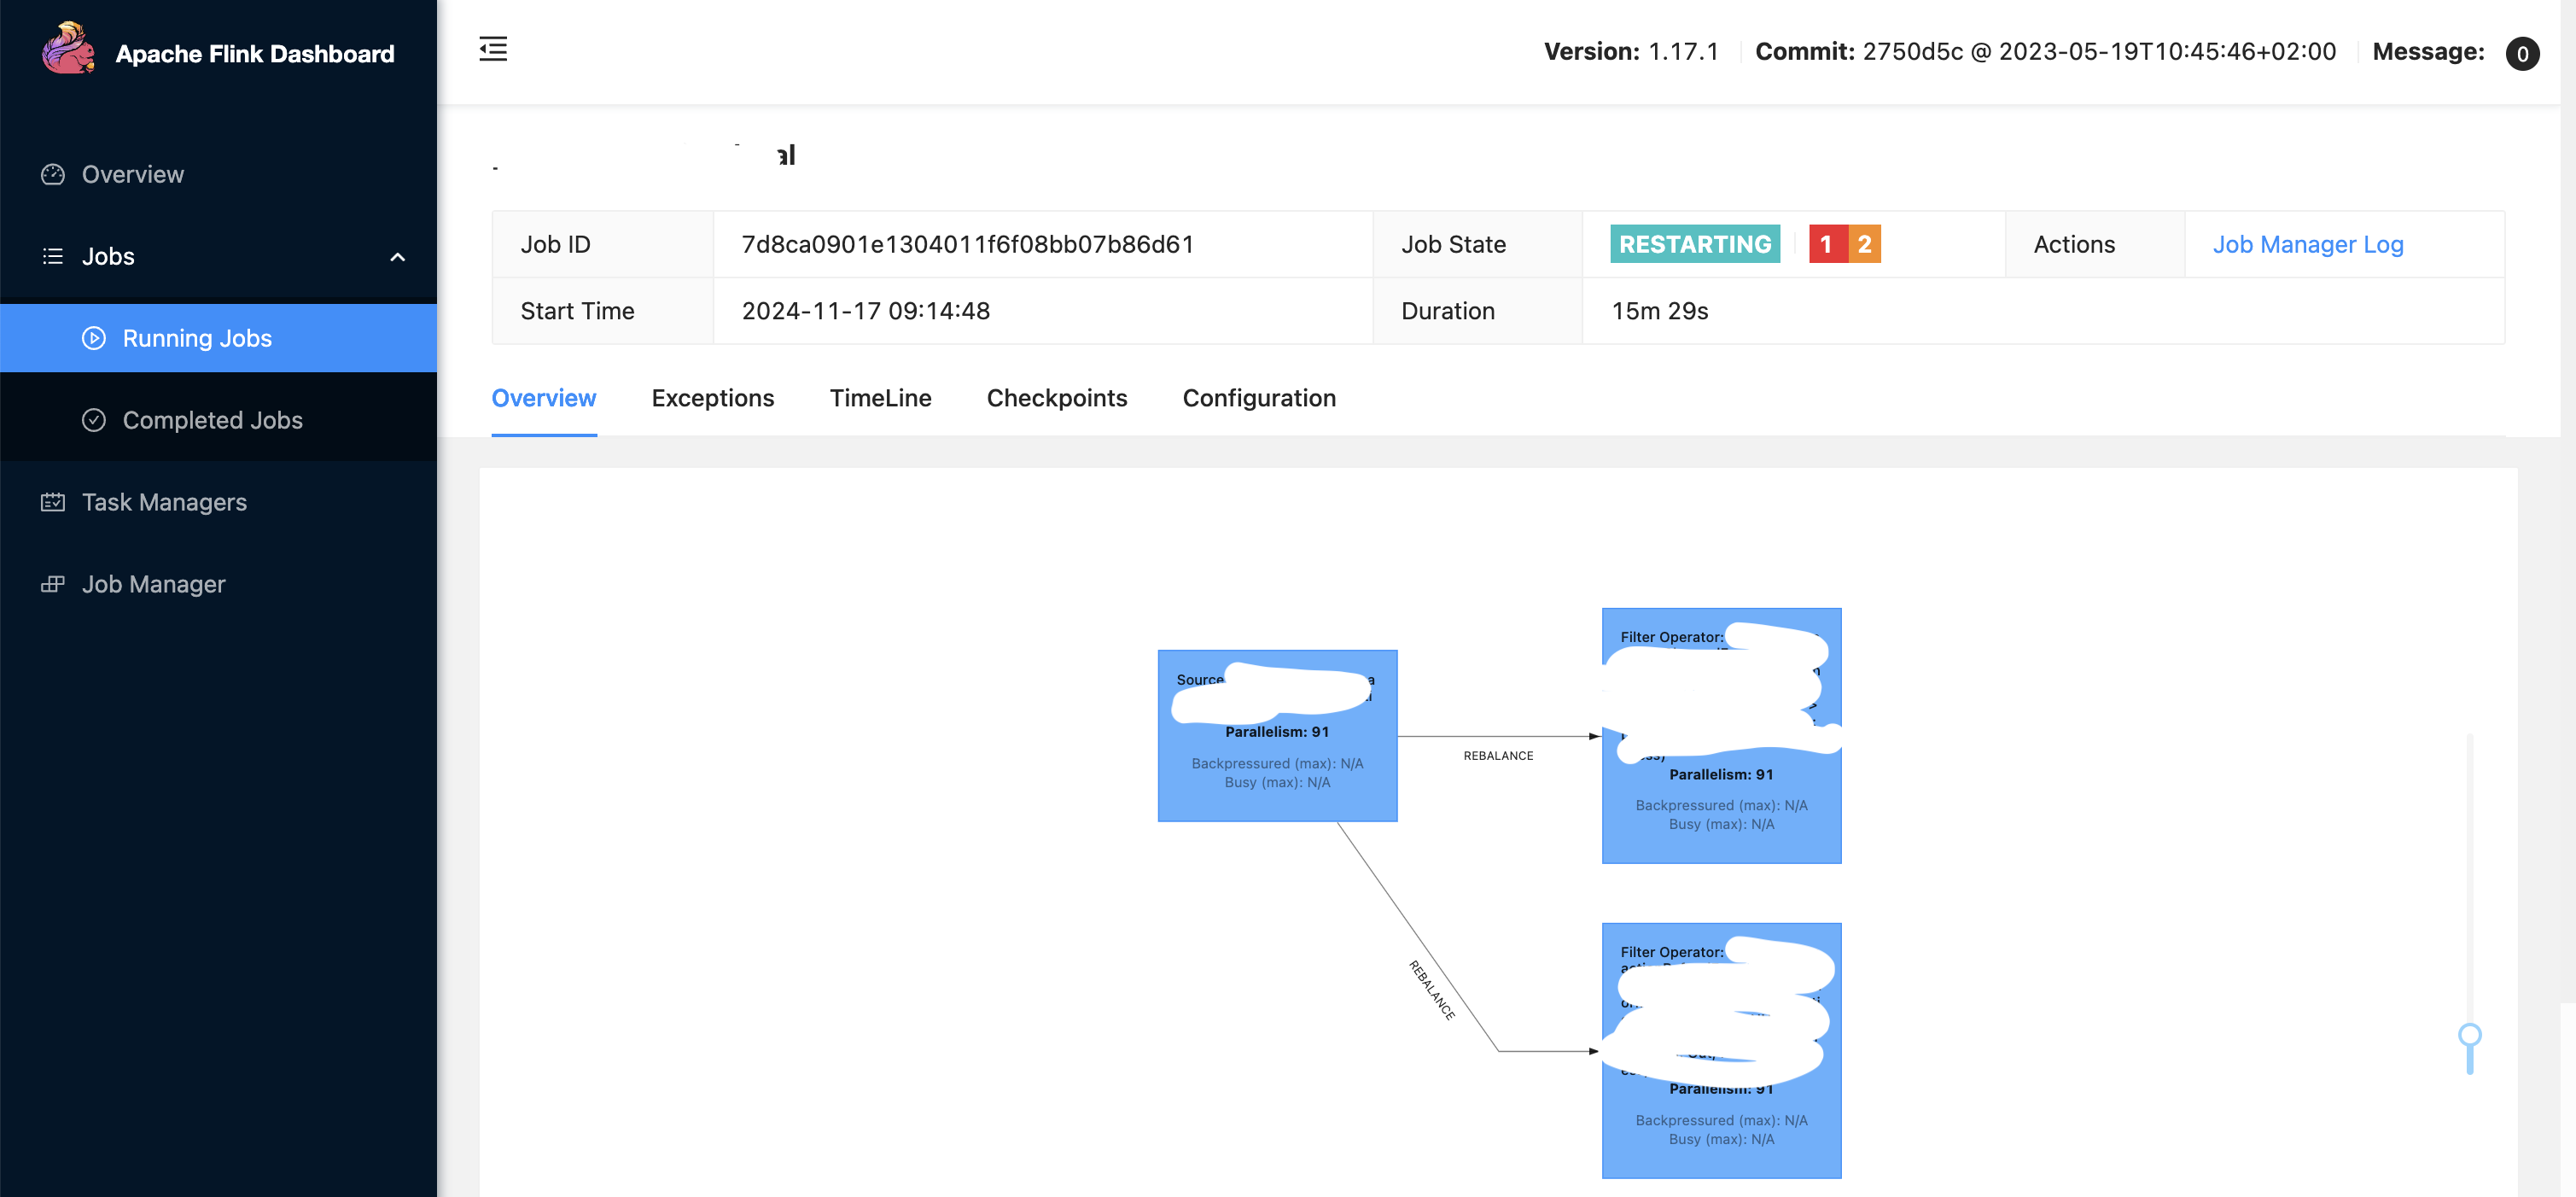
- In above pic, the pipeline is in failed state (red colour status in pic) probably because the underlying infra in the cluster is not able to support or provide for the given configuration. To fix it, one has to scale up the infra in cluster as well to support it, else tweak the configurations in code. For example: If each task manager has a config requirement defined as: taskManager: resource: memory: “2048m” cpu: 1; Then if 7 task managers are spinned up, then underlying machines should have the required infra. Also note scaling is 1 part, underlying infra should also be there in the fleet of machines/cluster to support the scaling.
- How to decide parallelism in flink?: Ideally you set the parallelism to the number of slots you have in your cluster. Another example: Imagine you are choosing between a parallelism of 50 with 2 cores per slot, or a parallelism of 100 with 1 core per slot. In both cases the same resources are available – which will perform better?: One can expect fewer slots with more cores per slot to perform somewhat better, in general, provided there are enough tasks/threads per slot to keep cores busy (if the whole pipeline fits into one task this might not be true, though deserializers can also run in their own thread). With fewer slots you’ll have more keys and key groups per slot, which will help to avoid data skew, and with fewer tasks, checkpointing (if enabled) will be a bit better behaved. Inter-process communication is also a little more likely to be able to take an optimized (in-memory) path.
- Useful: ref, ref2, ref3
- Case 1:
- Task Managers: They are the worker nodes that execute the tasks assigned by the Job Manager. Each Task Manager can run multiple tasks in parallel, depending on the number of task slots it has. Another definition; A Taskmanager (TM) is a JVM process, whereas a Taskslot (TS) is a Thread within the respective JVM process (TM). The managed memory of a TM is equally split up between the TS within a TM. No CPU isolation happens between the slots, just the managed memory is divided. Moreover, TS in the same TM share TCP connections (via multiplexing) and heartbeat messages. They may also share data sets and data structures, thus reducing the per-task overhead. For example, if a Task Manager has four slots then it will allocate 25% of the memory to each slot. There could be one or more threads running in a task slot. Threads in the same slot share the same JVM. Tasks in the same JVM share TCP connections and heart beat messages. You can run multiple Task Managers on a single machine or across multiple machines. The number of Task Managers you can effectively run on a single server depends on the available resources (CPU, memory) and the workload’s resource requirements. A task slot is basically a thread pool.
- Checkpointing and State Management:
- Check pointing is Flink’s backbone for providing consistent fault tolerance. It keeps on taking consistent snapshots for distributed data streams and executor states. It is inspired by the Chandy-Lamport algorithm but has been modified for Flink’s tailored requirement. Flink supports stateful computations where operators maintain state across events.
- The fault-tolerant mechanism keeps on creating lightweight snapshots for the data flows. They therefore continue the functionality without any significant over-burden. Generally the state of the data flow is kept in a configured place such as HDFS. In case of any failure, Flink stops the executors and resets them and starts executing from the latest available checkpoint.
- Stream barriers are core elements of Flink’s snapshots. They are ingested into data streams without affecting the flow. Barriers never overtake the records. They group sets of records into a snapshot. Each barrier carries a unique ID. The following diagram shows how the barriers are injected into the data stream for snapshots:
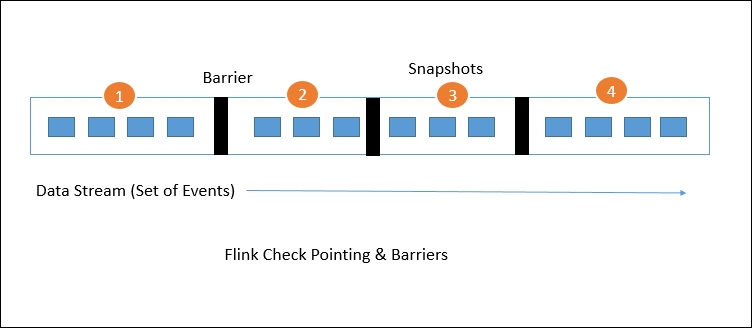 (Source: ref)
 - Each snapshot state is reported to the Flink Job Manager’s checkpoint coordinator. While drawing snapshots, Flink handles the alignment of records in order to avoid re-processing the same records because of any failure. This alignment generally takes some milliseconds. But for some intense applications, where even millisecond latency is not acceptable, we have an option to choose low latency over exactly a single record processing. By default, Flink processes each record exactly once. If any application needs low latency and is fine with at least a single delivery, we can switch off that trigger. This will skip the alignment and will improve the latency.
- Resource Manager: The Resource Manager oversees resource allocation across the cluster, ensuring that Task Managers have enough resources to execute their tasks effectively.
- Deployment Modes: Apache Flink supports different deployment modes for Flink jobs. JobManager supports multiple job submission modes such as:
- Application mode: This mode creates one cluster per submitted application. A dedicated JobManager is started for submitting the job. The JobManager will only execute this job, then exit.
- Session mode: Session mode assumes an already running cluster and uses the resources of that cluster to execute any submitted application. Applications executed in the same (session) cluster use, and consequently compete for, the same resources. This has the advantage that you do not pay the resource overhead of spinning up a full cluster for every submitted job.
- Data movement in Flink:
- Shuffle and rebalance are two important concepts related to data distribution and task execution.
- The shuffle() operation redistributes data across partitions in a random manner. It partitions elements uniformly according to a uniform distribution.
- The rebalance() operation redistributes data across partitions in a round-robin fashion, ensuring that each partition receives an equal amount of data.
- They both involve redistributing data across partitions but do so in different ways and for different purposes. When operations like keyBy(), shuffle(), or rebalance() are encountered, Flink performs network shuffling to redistribute data between tasks.
- Useful: ref, ref2
- Shuffle and rebalance are two important concepts related to data distribution and task execution.
- Flink Deployment in EKS: In summary;
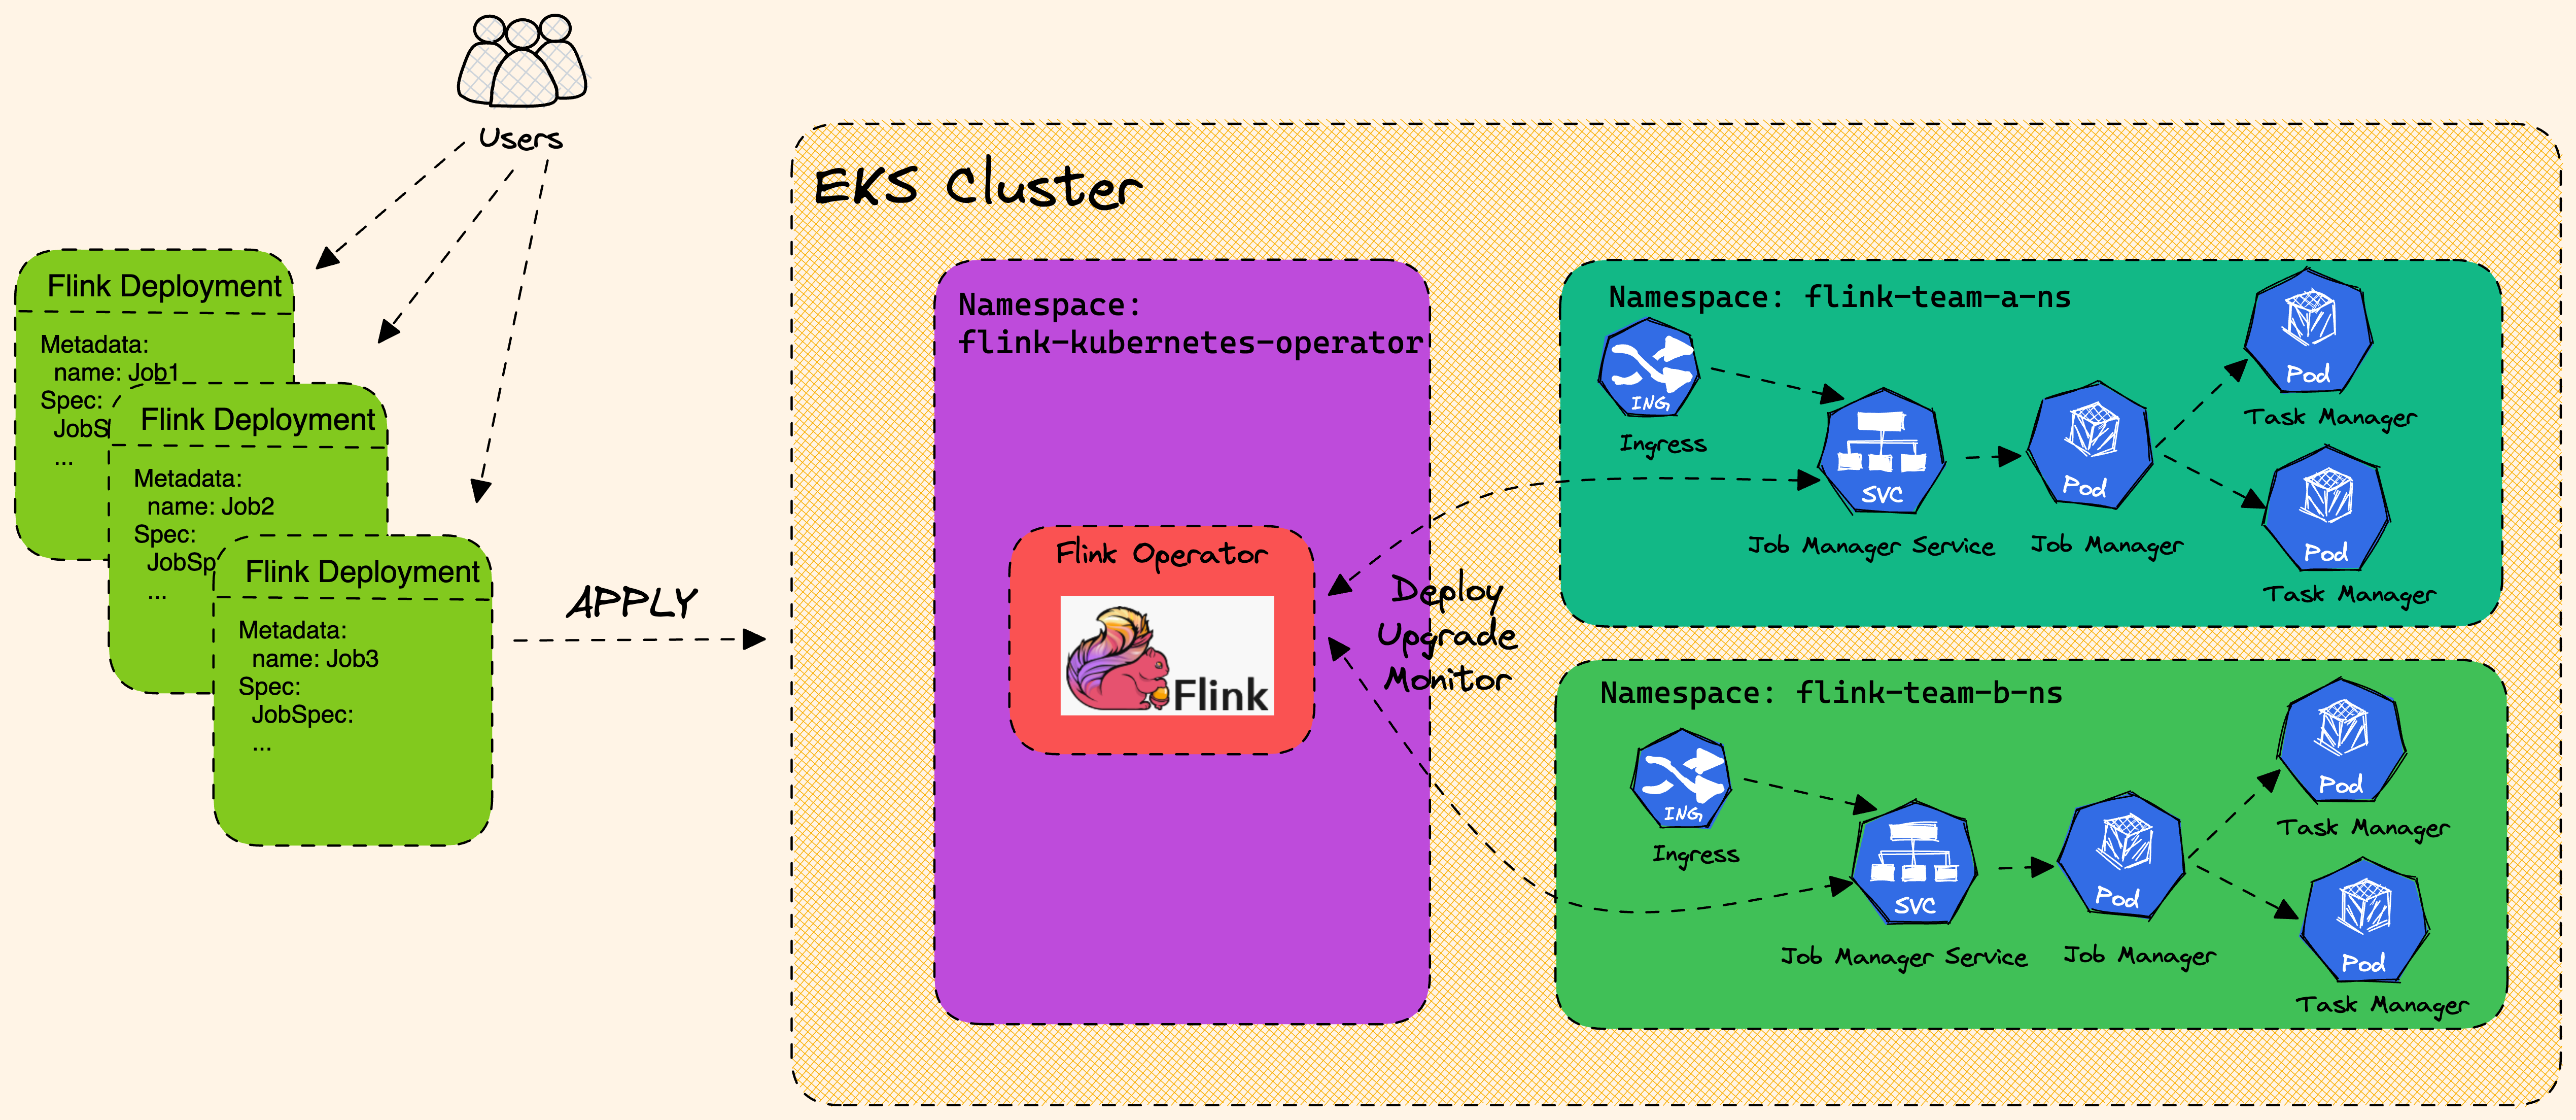 (Source: ref)
 - At Simpl: Historically, we had on-demand EC2 machines, running flink pipelines (JobManager, TaskManagers, etc.). It was a shared cluster. As number of pipelines started to increase it was observed that there were issues, like if one pipeline consumes more resources, other pipelines were effected.
- More details around issues faced in past around this, written here: ref
- Hence we moved to EKS with application mode in Flink. EKS is running on spot instances machines in AWS (cost optimization).
- Few K8s terminologies:
- Controller: Control loops that watch the state of your cluster and request changes where needed, trying to move the current state closer to the desired state. Kubernetes already comes with built-in controllers that run inside the kube-controller-manager.
- Daemon Set: A component that makes sure a pod is running across a set of nodes in a cluster. A daemon set creates pods when a node is added, and garbage collects pods whenever a node is removed from a cluster.
- etcd: An open-source distributed key-value store which stores and manages the configuration data, state data and metadata for Kubernetes. etcd serves as the ‘single truth’ about the status of the system.
- Ingress: An API object that allows external access (aka outside the Kubernetes cluster) to your application. You need an ingress controller to read the Ingress resource information, process that data and get traffic into your Kubernetes cluster.
- Kubectl: A command line tool for communicating with a Kubernetes API server, used to create and manage Kubernetes objects.
- Kubelet: Kubelets are an essential part of a Kubernetes cluster. Part of each node in the cluster, Kubelets make sure containers are actually running in a pod via the Kubernetes API server. They’re also responsible for registering a node within a cluster and reporting on resource utilisation.
- Kube-controller-manager: Embeds the core control loops shipped with Kubernetes.
- Kubernetes API Server: Provides the frontend to the cluster’s shared state, which is where all of the other components interact, and validates and configures data for API objects.
- Kube-proxy: A network proxy that runs on each node in your cluster, maintaining network rules on nodes, which allows for network communication to your pods. It can run in one of these three modes: userspace, iptables or IPVS.
- Kube-scheduler: The default scheduler for Kubernetes, kube-scheduler is charge of scheduling pods onto nodes.
- Minikube: A tool that runs a single-node cluster inside a Virtual Machine on your computer. You can use Minikube to test out Kubernetes in a learning environment.
- Namespace: A virtual cluster where you can provision resources and provide scope for pods, services and deployments. They provide a scope for unique naming in order to divide cluster resources in an environment when there are several teams and/or projects.
- Operators: A way to make use of custom resources to create and manage applications and components.
- Pod: The smallest object of the Kubernetes ecosystem, a Pod represents a group of one or more containers running together on your cluster.
- Service: An abstraction which defines a set of pods and makes sure that network traffic can be directed to the pods for the workload.
-
Flink logs are pushed to Opensearch in flink related log index & deployment pipeline uses concourse. Consider this config:
taskmanager.numberOfTaskSlots: "5" jobManager: resource: memory: "2048m" cpu: 2 taskManager: resource: memory: "16g" cpu: 4 ## And say we set the pipeline parallelism as 10. ## This would mean 10/5 ~ 2 Task managers would be spawned. We must have underlying infra with the given requirements else, it would be difficult to scale up. ## Assume we have 1 Job manager- Pod is the smallest unit in K8s. In a single pod, it is possible to have multiple containers running, but generally there is only a single container running. You can image a 1:1 mapping in Pod:Container.
- Based on above configs ideally there would be 1 (for JManager) + 2 (for TManager) = 3 containers running in the namespace or 3 pods running in the namespace.
- Pods will be running on a single/multiple EC2 machines, but it will be ensured that the infra which is given in defined in config file is provided. So consider the 2 Task managers, each one running in a pod would be running on top of a machine with 16g memory and 4 cpu cores. For both of them it would be 32g memory and 8 cpu cores in total.
- It depends if your underlying infra has these resources to provide for the task/job managers. If not, pipeline will start failing.
- We use Karpenter to scale K8s infra & other aspects to improvise the overall ecosystem like auto-scaling, etc., is wip.
- Comparing Flink & Spark
- Similarities in Architecture:
- Driver Node vs. Job Manager
- Spark Driver: In Spark, the driver node is responsible for orchestrating the execution of tasks, managing the Spark Context, and scheduling jobs.
- Flink Job Manager: Similarly, in Flink, the Job Manager performs these functions by coordinating job execution, scheduling tasks, and managing resources across the cluster.
- Worker Nodes vs. Task Managers
- Spark Workers: Spark’s worker nodes execute tasks assigned by the driver. Each worker can run multiple executors, which are responsible for running individual tasks.
- Flink Task Managers: Flink’s Task Managers are analogous to Spark workers. They execute the tasks assigned by the Job Manager and manage task slots to run multiple instances of operators concurrently.
- Task Slots vs. Executors
- Spark Executors: Executors in Spark are responsible for executing tasks and managing memory and resources for those tasks.
- Flink Task Slots: In Flink, task slots represent the capacity of a Task Manager to run parallel instances of operators. Each task slot can execute one operator instance at a time.
- Support for Batch and Streaming Processing
- Unified Processing Capabilities: Both Spark and Flink provide capabilities to handle both batch and streaming data processing. While they have different underlying architectures (micro-batching for Spark and true streaming for Flink), they allow users to work with various types of data workloads using similar APIs.
- APIs for Data Processing: Both frameworks offer high-level APIs that abstract the complexities of distributed data processing, making it easier for developers to implement data transformations and analytics without needing to manage the underlying infrastructure directly.
- Driver Node vs. Job Manager
- Key Differences:
- Processing Model: Batch vs. Streaming
- Spark: Originally designed for batch processing, Spark introduced micro-batching to handle streaming data. This means it processes data in small batches rather than as individual events.
- Batch Processing: Spark’s batch processing model is highly optimized for large-scale data operations, leveraging in-memory computation to speed up data processing significantly compared to traditional disk-based systems.
- Micro-Batching: In Spark Streaming, data is divided into micro-batches, which can introduce latency due to the waiting period for enough data to form a batch. The duration of these micro-batches can be configured, impacting both latency and throughput.
- Structured Streaming: With the introduction of Structured Streaming, Spark has improved its ability to handle continuous data streams while providing a more unified API for both batch and streaming workloads.
- Flink: Flink is built from the ground up as a true streaming engine, processing each event in real-time with very low latency. This allows it to handle streaming workloads more efficiently than Spark.
- Event-Driven Architecture: Flink’s architecture is inherently event-driven, allowing it to react to incoming data immediately without waiting for a batch, thus providing true real-time processing capabilities.
- Unified Processing Model: Flink treats both batch and streaming data as streams, allowing users to apply the same operations regardless of the data type. This simplifies development and reduces complexity in workflows.
- Latency and Throughput
- Spark: The micro-batch model can introduce latency since it waits for a batch of data before processing.
- Latency Factors: The latency can vary based on the size of the micro-batch and the complexity of the transformations being applied. For applications requiring low-latency responses, tuning the batch interval is crucial.
- Throughput Optimization: Spark optimizes throughput through techniques like partitioning and parallel execution, which can help mitigate some latency issues but may not eliminate them entirely.
- Flink: Flink’s event-driven architecture allows for lower latency since it processes each event as soon as it arrives.
- Sub-Second Latency: Flink is capable of achieving sub-second latencies even under high load conditions due to its efficient resource management and pipelined execution model.
- Backpressure Handling: Flink’s backpressure mechanism dynamically adjusts the flow of data between operators based on their processing speeds, ensuring that no single component becomes a bottleneck.
- Spark: The micro-batch model can introduce latency since it waits for a batch of data before processing.
- State Management: State Handling
- Spark: While Spark can maintain state through its structured streaming API, it does not have built-in support for complex stateful operations.
- Stateful Operations in Structured Streaming: Spark allows maintaining state across batches using stateful transformations like mapGroupsWithState, but these operations may not be as flexible or efficient as Flink’s state handling capabilities.
- External State Management: For complex state management needs, Spark often relies on external systems (like databases or key-value stores), which can introduce additional latency and complexity.
- Flink: Flink provides robust state management capabilities with exactly-once processing semantics, making it suitable for complex event-driven applications that require maintaining state over time.
- Keyed State vs. Operator State: Flink differentiates between keyed state (state associated with specific keys) and operator state (state associated with an operator), allowing fine-grained control over how state is managed and accessed.
- State Backends: Flink supports various state backends (e.g., RocksDB, Memory) that allow users to choose how state is stored and managed during processing. This flexibility can optimize performance based on workload characteristics.
- Spark: While Spark can maintain state through its structured streaming API, it does not have built-in support for complex stateful operations.
- Fault Tolerance: Fault Recovery
- Spark: Utilizes Resilient Distributed Datasets (RDDs) to achieve fault tolerance by reconstructing lost data from lineage information.
- RDD Lineage Graphs: RDDs maintain lineage information that allows Spark to recompute lost partitions from original data sources or previous transformations, which is efficient but may incur overhead during recovery.
- Checkpointing Mechanisms: Spark supports checkpointing RDDs to reliable storage systems (like HDFS), enabling recovery from failures without needing to recompute everything from scratch.
- Flink: Implements a distributed snapshot mechanism that captures application state at checkpoints, allowing for faster recovery with minimal disruption.
- Lightweight Snapshots: Flink’s checkpointing mechanism uses lightweight snapshots that capture the current state of all operators without stopping the entire job. This ensures minimal disruption during recovery processes.
- Stream Barriers for Consistency: Flink uses stream barriers to delineate records that belong to different snapshots, ensuring that all records are processed consistently across distributed operators during recovery.
- Spark: Utilizes Resilient Distributed Datasets (RDDs) to achieve fault tolerance by reconstructing lost data from lineage information.
- Spark: Originally designed for batch processing, Spark introduced micro-batching to handle streaming data. This means it processes data in small batches rather than as individual events.
- Processing Model: Batch vs. Streaming
- Similarities in Architecture:
- Stateful pipelines:
- Making any changes in operators, like changing its UID or so, in a pipeline where deployment configuration eks yaml is set to last-state and redeploying changes in Flink-EKS, can cause issues with job coming up as the job manager may run into issues when constructing the job graph from the old checkpoint if not handled properly. Even if we clean up the checkpoint/savepoint folder (btw, in a stateful pipeline, there should be both checkpoint/savepoint folders, else it will give errors. We can’t have either of one only) and redeploy, there can be issues.
- One may have to clear up all the resources of the EKS container and rebuilt it (with whatever config is present in eks yaml file and use the kubectl commands). Other way is we set the pipeline to stateless and deploy with the new changes, let it checkpoint in background, and then revert back upgradeMode state to last-state, with this it may come up without issues. For unprocessed data in stream you could set the kafka offset to 1hr back (temporarily, later revert to latest offset), so that it reprocesses from an hour back. Of course, if requirement is at-least once, then this has to be handled differently.
KafkaSource.builder().setStartingOffsets(OffsetsInitializer.latest()) - For latest offset reading KafkaSource.builder().setStartingOffsets(OffsetsInitializer.timestamp(1592323200000L)) - For time based offset reading. 1592323200000L - Will be epoch time in milliseconds (can be IST in our case)- In eks deployment yaml file you may use:
upgradeModekey. The upgradeMode setting determines how Flink jobs behave during upgrades or restarts:- last-state mode: When a job is upgraded or restarted, it will attempt to restore from the most recent successful checkpoint. This preserves the processing state and allows the job to continue from where it left off.
- stateless mode: The job will start from scratch after an upgrade, without attempting to restore any previous state. This is like a completely fresh deployment.
- If you have checkpointing related configs in yaml; The checkpointing configuration remains active in both modes - it’s just that the stateless mode ignores existing checkpoints when pipeline starting up.
- Savepoint vs Checkpoint in Flink:
- Checkpoints:
- Automatic, periodic snapshots for fault tolerance
- Managed by Flink (created/deleted automatically)
- Optimized for quick recovery from failures
- Savepoints:
- Manual, user-triggered snapshots for planned operations
- Managed by users (require manual creation/deletion)
- Complete state snapshots that support application evolution and upgrades
- Checkpoints:
- Flink Operations:
- Transformations:
- map: One-to-one transformation that applies a function to each element.
dataStream.map(event -> event.toUpperCase());- flatMap: One-to-many transformation that can produce zero, one, or multiple elements for each input.
dataStream.flatMap((event, out) -> { for (String word : event.split(" ")) { out.collect(word); } });- filter: Keeps elements that satisfy a condition
dataStream.filter(event -> event.contains("error")); - Keying & Partitioning
- keyBy: Groups the stream by a key (creates a KeyedStream)
dataStream.keyBy(event -> event.getUserId());- shuffle: Redistributes elements randomly
dataStream.shuffle();- rebalance: Evenly distributes elements across tasks
dataStream.rebalance();- rescale: Redistributes elements in a round-robin fashion among downstream tasks
dataStream.rescale();- broadcast: Replicates each element to all parallel tasks
dataStream.broadcast() - Aggregations & Windows
- reduce: Combines elements of a KeyedStream using a reduce function
keyedStream.reduce((a, b) -> new Sum(a.value + b.value));- aggregate: Applies an aggregation function (like sum, min, max)
keyedStream.sum("amount"); keyedStream.min("latency"); keyedStream.max("value");- window: Groups elements of a stream into finite sets based on time or count
keyedStream.window(TumblingEventTimeWindows.of(Time.seconds(5))); keyedStream.window(SlidingProcessingTimeWindows.of(Time.seconds(10), Time.seconds(5))); keyedStream.countWindow(100, 10); // sliding count window- windowAll: Creates a window on a non-keyed stream
dataStream.windowAll(TumblingProcessingTimeWindows.of(Time.minutes(1))); - Joining & Combining
- join: Joins two data streams based on a key
stream1.join(stream2) .where(e1 -> e1.getKey()) .equalTo(e2 -> e2.getKey()) .window(TumblingEventTimeWindows.of(Time.seconds(5))) .apply((e1, e2) -> new Tuple2<>(e1, e2));- coGroup: Groups and joins two streams in a more flexible way than join
stream1.coGroup(stream2) .where(e1 -> e1.getKey()) .equalTo(e2 -> e2.getKey()) .window(TumblingEventTimeWindows.of(Time.seconds(5))) .apply(new CoGroupFunction<...>() {...});- union: Combines multiple streams of the same type
stream1.union(stream2, stream3);- connect: Combines two streams of potentially different types
stream1.connect(stream2) .map(new CoMapFunction<Type1, Type2, ResultType>() {...}); - Advanced Processing
- process: Offers the most flexibility for stream processing
keyedStream.process(new KeyedProcessFunction<Key, Input, Output>() { @Override public void processElement(Input value, Context ctx, Collector<Output> out) { // Access to keyed state, timers, side outputs, etc. } });- iterate: Creates a feedback loop in the dataflow
IterativeStream<Integer> iteration = input.iterate(); DataStream<Integer> iterationBody = iteration.map(/* do something */); iteration.closeWith(iterationBody.filter(/* termination logic */));- side output: Produces output to multiple side channels
OutputTag<String> rejectedTag = new OutputTag<String>("rejected"){}; SingleOutputStreamOperator<String> mainStream = dataStream.process( new ProcessFunction<String, String>() { @Override public void processElement(String value, Context ctx, Collector<String> out) { if (valid(value)) { out.collect(value); } else { ctx.output(rejectedTag, value); } } }); DataStream<String> rejectedStream = mainStream.getSideOutput(rejectedTag);- async I/O: Performs asynchronous operations on stream elements
AsyncDataStream.unorderedWait(
stream,
new AsyncDatabaseRequest(),
1000,
TimeUnit.MILLISECONDS,
100);
- Transformations:
- Watermarks:
- Watermarks are special markers that flow through your data stream, essentially telling the system: “All events with timestamps earlier than this watermark have likely arrived”. Note that it in no way indicates if data is processed downstream or not, just senses if data arrived or not. (example in end)
- Stream processing often needs to work with time windows (like “count events in the last 5 minutes”). But in distributed systems:
- Events arrive out of order
- Network delays happen
- Some data sources produce events with varying latency
- Without watermarks, your system would never know when it’s safe to finalize calculations for a time window. Watermarks work based on event time, not the system’s internal time. If you use no watermark strategy at all: By default, Flink doesn’t automatically generate watermarks. Your application would be operating in processing time rather than event time.
- Consider this code now (one of the watermark strategies):
WatermarkStrategy.<ApiEvent>forBoundedOutOfOrderness(Duration.ofSeconds(10)) ## This creates a watermark strategy that allows events to be up to 10 seconds late.- It doesn’t mean Flink is injecting watermarks into the stream every 10 seconds.
- What it actually means:
- Flink continuously monitors the timestamps of incoming events
- Whenever a new maximum timestamp is observed, Flink generates a new watermark
- This watermark is set to: (maximum observed timestamp - 10 seconds)
- The watermark advances whenever a new event with a higher timestamp arrives
- So the frequency of watermark generation depends on how often events with increasing timestamps arrive, not on a fixed 10-second interval.
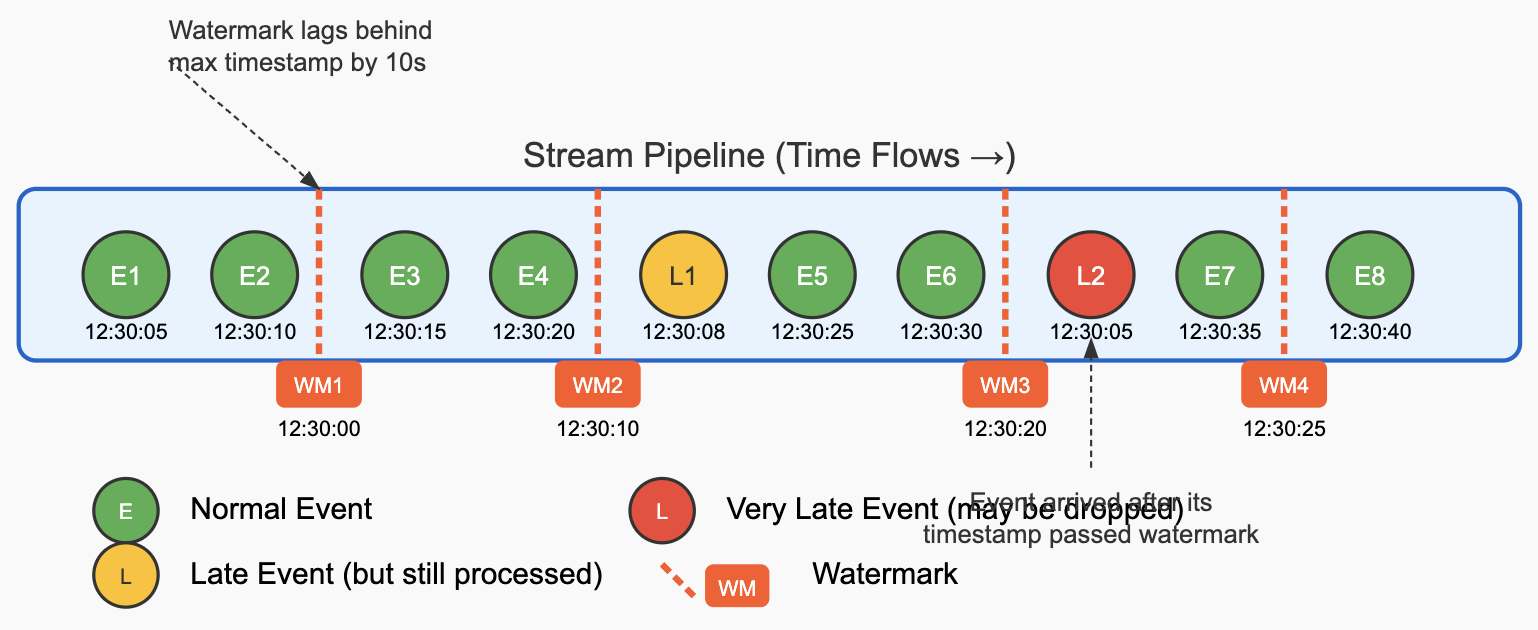
- In a Flink stream, watermarks advance through the data flow alongside regular events. The diagram below illustrates how watermarks look in a stream:
- Key Elements in the Diagram:
- Regular Events (Green): Normal data events with their timestamps (E1, E2, etc.)
- Watermarks (Orange Lines): Special markers that flow through the stream, indicating “we don’t expect any more events with timestamps earlier than this value”
- Late Events:
- Moderately Late (Yellow): Events that arrive after some later events but before the watermark passes their timestamp
- Very Late (Red): Events that arrive after the watermark has already passed their timestamp
- How Watermarks Advance (based on code example we took earlier):
- After E2 (12:30:10), Flink emits WM1 (12:30:00)
- WM1 is 10 seconds behind the maximum observed timestamp from all events present (12:30:10)
- This tells downstream operators: “Don’t expect any more events before 12:30:00”. It is an informer, but there is always a possibility events coming late or so. It later depends how we handle late incoming events.
- After E4 (12:30:20), Flink emits WM2 (12:30:10)
- Watermark advances to 10 seconds behind the new maximum timestamp
- Windows ending before 12:30:10 can now be processed and finalized
- Event L1 (12:30:08) arrives late, but after WM2
- This event is late (earlier than the max timestamp) but still after the current watermark
- It may be processed normally depending on how we define our configuration i.e if late events should be sidelined in a sidestream or drop it, etc.
- Windows that ended before 12:30:10 might have already been computed, so L1 might miss being included in its relevant windows The event could trigger late firings for windows that allow it For joins, it might still find matching partners if the relevant join state hasn’t been cleared
- After E6 (12:30:30), Flink emits WM3 (12:30:20)
- Event L2 (12:30:05) arrives very late, after WM3
- This event’s timestamp is earlier than the current watermark (12:30:20)
- It might be dropped or processed as a late event depending on your configuration
- After E7 (12:30:35), Flink emits WM4 (12:30:25)
- The watermarks essentially flow through your stream as special markers between regular data events. Each operator in your pipeline uses these watermarks to make decisions about when to trigger window computations, when to consider events as late, and when to emit results for operations like joins. For join operations, Flink waits until both input streams have received watermarks that cover the relevant time range before producing join results. This ensures that all potential matching events have been considered.
Mental model 1: Think of watermarks as the "last call" announcement in a restaurant. Imagine you're a chef in a busy restaurant with an open kitchen. Orders (events) come in with timestamps indicating when customers placed them. Your goal is to prepare meals efficiently while ensuring customers get their food in a reasonable order. Here's how watermarks work in this scenario: Orders (Events): Each order ticket has a timestamp showing when the customer placed it. Kitchen Processing (Stream Processing): Orders don't always arrive in your kitchen in the exact sequence they were placed - some might take longer to be written up or delivered to the kitchen. The Watermark Announcement: Every few minutes, the maître d' announces a "last call" time: "All orders placed before 7:30 PM should now be in the kitchen!" Moving Forward: This "last call" time (watermark) gradually advances throughout the evening, always staying slightly behind the most recent order timestamp you've seen. Late Order Handling: If an order ticket from 7:25 PM arrives after the 7:30 PM last call announcement, it's considered "late" - you'll still prepare it, but it might not be included in the current batch of meals you're completing. Table Completion: For table service (like window operations), you can confidently complete all dishes for a table once the last call time has passed the timestamp of the last order for that table. Mental model 2: Imagine you're standing on a beach, watching waves (your events) come in. Each wave carries a timestamp written on it, telling you when it formed out at sea. The watermark is like a colored line you draw in the sand. When you draw this line, you're declaring: "I'm reasonably confident all waves that formed before this time have already reached the shore." As you observe waves (events): You notice the timestamps on the waves that arrive You mentally track the most recent timestamp you've seen (max observed timestamp) You draw your line (watermark) 10 seconds behind that maximum timestamp You gradually move this line forward as newer timestamps arrive Sometimes, a smaller wave arrives late - it formed earlier but took longer to reach you. If this wave's formation time is before your current line in the sand, you consider it a "late arrival" that missed your expectations. For operations like joins, imagine you're trying to match pairs of colored shells from two different sections of beach. You need to be confident you've seen all shells up to a certain time from both sections before you can finalize your matching. Mental model 3: Imagine watermarks as a special clock that runs alongside your data stream: The Special Clock: This clock doesn't tick based on real-time but instead advances based on the timestamps in your data. Snapshot Moments: Whenever this clock ticks forward, it takes a "snapshot" of the system state, declaring "everything before this timestamp should have been processed by now." Lagging Behavior: This clock deliberately runs slower than the actual event timestamps - it stays 10 seconds (or whatever your configuration is) behind the highest timestamp seen. Processing Decisions: When this clock reaches a certain time T, the system uses that snapshot to make decisions like: "We can now finalize calculations for time windows ending before T" "Any event with timestamp before T that arrives now is considered late" "Join operations can emit results for events with timestamps before T" Advancing Mechanism: The clock advances not based on wall-clock time, but when new events with higher timestamps arrive in the system. This model captures how watermarks serve as an internal timing mechanism that allows distributed stream processors to make coordinated decisions about when certain operations can be considered complete, based on the timestamps present in the data itself rather than external time. - After E2 (12:30:10), Flink emits WM1 (12:30:00)
- If watermarks are set to the latest timestamp without any delay (i.e., no buffer for late events), several significant problems can arise in real-time streaming applications: Problems with Improper Watermark Configuration:
- Excessive Late Event Dropping
- Without a delay buffer, any event arriving slightly out of order would be considered late
- This leads to data loss and incomplete results in aggregations and joins
- In distributed systems, perfect ordering is practically impossible
- Incorrect Join Results
- Join operations may produce incomplete or wrong results
- If event A from stream 1 should join with event B from stream 2, but B arrives after the watermark has passed, the join will be missed
- Premature Window Closing
- Time-based windows will close too early
- Events that are only slightly delayed would miss their intended windows
- This creates inaccurate aggregations (sums, counts, averages would be wrong)
- Inconsistent State
- Different operators in your pipeline might process different subsets of data
- This leads to inconsistent state throughout the application
- By default, a new watermark is generated every 200ms in Apache Flink.
- How Watermarks Flow Through the System:
- Generation: Watermarks are created at sources or after a timestamp assigner.
- Propagation: Watermarks flow through the operator chain just like regular records.
- Operator Behavior:
- When an operator receives a watermark, it first processes any pending events with timestamps less than the watermark
- Then it forwards the watermark downstream
- For stateful operations, this often triggers state cleanup and window completion
- Multiple Input Streams: For operators with multiple inputs (like joins), Flink uses the minimum watermark from all inputs.
- Idleness Handling:
- The idleness detection in stream prevents watermarks from stalling when a stream goes quiet:
- If no events arrive for 2 minutes, the stream is marked as idle
- Flink continues advancing watermarks even without new events
- This allows downstream processing to continue rather than waiting indefinitely
- This is crucial for multi-stream operations like your interval join
- Without this, if one stream stops receiving events, its watermark would freeze, potentially blocking the progress of joins. This ensures that your entire pipeline doesn’t stall if one stream temporarily stops producing events.
-
Eg:
.withIdleness(Duration.ofMinutes(2))
In above, by using this setting,
if no events arrive for 2 minutes, Flink will assume the stream is idle and
advance its watermark to match the system time.
- The idleness detection in stream prevents watermarks from stalling when a stream goes quiet:
- Timestamp Assignment:
- Below eg.; It extracts the actual event time from each record, converting the timestamp string to milliseconds since epoch.
.withTimestampAssigner((event, l) -> { return OffsetDateTime .parse(event.getEvent_timestamp()) .toInstant() .toEpochMilli(); }) - Example of all: Consider a below piece of code, where we have 2 streams joining:
// Stream of events
SingleOutputStreamOperator<BaseEventA> eventAMappedStream = StreamA
        .process(new eventAMapper())
        .assignTimestampsAndWatermarks(
                WatermarkStrategy.<BaseEventA>forBoundedOutOfOrderness(Duration.ofSeconds(10))
                        .withIdleness(Duration.ofMinutes(2))
                        .withTimestampAssigner((SerializableTimestampAssigner<BaseEventA>) (event, l) -> {
                            Long timeStamp = null;
                            timeStamp = OffsetDateTime.parse(event.getEventTimestamp()).toInstant().toEpochMilli(); // Watermarking based on event timestamp
                            return timeStamp;
                        })
        )
        .uid("EventA-Stream")
        .name("EventA-Stream");

SingleOutputStreamOperator<BaseEventB> eventBMappedStream = streamB
        .process(new eventBMapper())
        .assignTimestampsAndWatermarks(
                WatermarkStrategy.<BaseEventB>forBoundedOutOfOrderness(Duration.ofSeconds(10))
                        .withIdleness(Duration.ofMinutes(2))
                        .withTimestampAssigner((SerializableTimestampAssigner<BaseEventB>) (event, l) -> {
                            Long timeStamp = null;
                            timeStamp = OffsetDateTime.parse(event.getEventTimestamp()).toInstant().toEpochMilli();
                            return timeStamp;
                        })
        )
        .uid("EventB-Stream")
        .name("EventB-Stream");

// Join the stream A and stream B events based on say, token attribute present in both events
SingleOutputStreamOperator<ProcessedEvent> joinedStream = eventAMappedStream.keyBy(BaseEventA::getTokenA)
        .intervalJoin(
                eventBMappedStream.keyBy(BaseEventB::getTokenB)
        )
        .between(Time.seconds(-60), Time.seconds(60))
        .process(new ProcessedEventMapper())
        .uid("Processed-Join-Stream-Event")
        .name("Processed-Join-Stream-Event");
- Understanding Watermarks and Windows in Stream Processing
- Let’s consider the two streams in your code:
- eventAMappedStream - Events from set of services A - Stream 1
- eventBMappedStream - Events from set of services B - Stream 2
- Step 1: Event Arrival and Timestamp Assignment: Imagine we receive these events in our system (not necessarily in timestamp order):
- Stream 1:
- Event A: arrives at 12:30:00 system time, timestamp 12:29:50 (don’t confuse with services A,B, etc., just imagine it as another event)
- Event B: arrives at 12:30:05 system time, timestamp 12:29:55
- Event C: arrives at 12:30:10 system time, timestamp 12:29:45 (notice it’s out of order)
- Event D: arrives at 12:30:15 system time, timestamp 12:30:05
- Stream 2:
- Event W: arrives at 12:30:02 system time, timestamp 12:29:52
- Event X: arrives at 12:30:08 system time, timestamp 12:29:58
- Event Y: arrives at 12:30:12 system time, timestamp 12:29:48 (out of order)
- Event Z: arrives at 12:30:18 system time, timestamp 12:30:08
- Stream 1:
- Step 2: Watermark Generation: For both streams, you’re using WatermarkStrategy.
forBoundedOutOfOrderness(Duration.ofSeconds(10)). Here's how watermarks progress in each stream: - Stream 1 Watermarks:
- After Event A (12:29:50): Watermark = 12:29:40
- After Event B (12:29:55): Watermark = 12:29:45
- After Event C (12:29:45): Watermark doesn’t change (still 12:29:45) since C isn’t a new maximum
- After Event D (12:30:05): Watermark = 12:29:55
- Stream 2 Watermarks:
- After Event W (12:29:52): Watermark = 12:29:42
- After Event X (12:29:58): Watermark = 12:29:48
- After Event Y (12:29:48): Watermark doesn’t change (still 12:29:48)
- After Event Z (12:30:08): Watermark = 12:29:58
- Stream 1 Watermarks:
- Step 3: What Happens in the Join Operation: In your code, you’re doing an interval join with: .between(Time.seconds(-60), Time.seconds(60)); This means for each event in Stream 1, Flink will look for matching events in Stream 2 within a 2-minute window centered on the timestamp of the Stream 1 event (60 seconds before and 60 seconds after). For example:
- When Event A (12:29:50) arrives, it looks for Stream 2 events with timestamps between 12:28:50 and 12:30:50
- This would match Events W, X, Y, and Z if they have the same key
- Step 4: How Watermarks Control the Join: Now for the critical part - watermarks determine when Flink can safely process and emit joined results:
- When the watermark reaches a certain point in time T, Flink knows it shouldn’t expect any more events with timestamps earlier than T
- For joins, Flink needs to wait for the watermark to advance far enough in BOTH streams before it can be sure it has all the potential matches for a join
- The actual point at which Flink emits results depends on:
- The current watermark in both streams (Flink takes the minimum of the two)
- The time boundaries of your join window
- For example, when both streams have watermarks past 12:29:55, Flink can safely process and emit joined results for events with timestamps around 12:28:55 (considering your 60-second lower bound).
- Example of Specific Join Processing
- Let’s trace through a specific join scenario:
- Event A (From stream 1, timestamp 12:29:50) arrives with key “token123”
- Event W (From stream 2, timestamp 12:29:52) arrives with key “token123”
- A match is found, but Flink doesn’t immediately emit the result
- Flink waits until watermarks in both streams advance past 12:29:50 (plus the join window upper bound)
- Once watermarks in both streams are past this time, Flink can emit the joined result
- The Difference Between Watermarks and Windows:
- Watermarks are a mechanism to track the progress of event time in the system. They answer the question: “Up to what point in event time have we likely seen all events?”
- Windows define the time ranges over which operations (like joins or aggregations) are performed. They answer the question: “What time range of events should be considered together for this operation?”
- In your code: The forBoundedOutOfOrderness(Duration.ofSeconds(10)) controls watermark generation; The .between(Time.seconds(-60), Time.seconds(60)) defines the join window
- The Role of withIdleness(Duration.ofMinutes(2)): This is an important addition that tells Flink to continue advancing watermarks even if a stream doesn’t receive events for a while. Without this, if one stream stops receiving events, its watermark would freeze, potentially blocking the progress of joins. By using this setting, if no events arrive for 2 minutes, Flink will assume the stream is idle and advance its watermark to match the system time. This ensures that your entire pipeline doesn’t stall if one stream temporarily stops producing events.
- It is highly recommended that you specify operator IDs via the uid(String) method (as seen in code). These IDs are used to scope the state of each operator. If you do not specify the IDs manually they will be generated automatically. You can automatically restore from the savepoint as long as these IDs do not change. The generated IDs depend on the structure of your program and are sensitive to program changes. Therefore, it is highly recommended assigning these IDs manually.
- Let’s consider the two streams in your code:
- Flink Filesink API to write data to a filesystem sink:
- This connector provides a unified Sink for BATCH and STREAMING that writes partitioned files to filesystems supported by the Flink FileSystem abstraction; Eg: S3, Azure Blob, GCP, etc.
- Checkpointing needs to be enabled when using the FileSink in STREAMING mode. Part files can only be finalized on successful checkpoints. If checkpointing is disabled, part files will forever stay in the in-progress or the pending state, and cannot be safely read by downstream systems. Doc: ref
- Flink’s FileSink which helps write data to S3 works in:
- File Lifecycle Stages: Files go through multiple states:
- In-progress: Currently being written to
- Pending: Closed for writing but waiting for commit
- Finished: Successfully committed to the final location
- File Committing: Checkpointing Requirement: The FileSink only commits files when:
- A checkpoint completes successfully (in streaming mode)
- The job finishes completely (in batch mode)
- In Flink, if checkpointing is not explicitly enabled in your job, there is no default checkpointing. This means:
- For streaming jobs: Without checkpointing, the FileSink will buffer data in the “in-progress” files. These files will never automatically transition to the “finished” state. The data will remain in the in-progress state indefinitely. The data will only be properly committed to S3 when the job completes gracefully.
- For batch jobs: Files are committed when the job completes successfully, No checkpointing is needed for batch processing.
- In a production environment without checkpointing:
- Data will eventually appear in S3, but only after the job terminates normally. If the job crashes or is forcibly terminated, the in-progress files may be lost. You lose exactly-once guarantees without checkpointing.
- For Flink’s FileSink specifically:
- It uses a transaction-like approach to writing files. Without checkpoints, it maintains the “in-progress” files but doesn’t commit them. There’s no default timeout or automatic flush to finalize these files.
- If you need data to appear in S3 without waiting for job completion or explicit checkpoints, you should either:
- Enable checkpointing with a reasonable interval (such as every 1-5 minutes). Use a different sink implementation that doesn’t rely on Flink’s checkpointing mechanism. Configure a very aggressive rolling policy, though this still requires checkpointing for final commits.
- File Lifecycle Stages: Files go through multiple states:
- A rolling policy in Flink’s FileSink determines when to close the current in-progress file and start writing to a new one. It doesn’t control when data is committed to its final destination - that’s still determined by checkpoints. Rolling policies typically consider:
- Size: Close a file when it reaches a certain size (e.g., 5MB)
- Time-based rollover: Close a file after a specific time has passed (e.g., 1 minute)
- Inactivity: Close a file if no new data has arrived for some time (e.g., 30 seconds)
- Flink stores various files as part of checkpointing to ensure that the application state can be recovered in case of failures. Here’s a breakdown of what Flink stores during checkpointing:
- State Snapshot Files
- Operator State Files: Contains the state for each operator in your Flink job: Keyed state (e.g., ValueState, ListState, MapState), Operator state (e.g., ListState for non-keyed operators), Window state (e.g., window contents and triggers).
- Metadata Files: Information about the checkpoint itself: Checkpoint ID and timestamp, Job/Task information, References to all state files, Completion status
- Barrier Information: Data about the checkpoint barriers that were used to create the checkpoint
- For File Systems (like FileSink): When using the FileSink or similar components, checkpoints also store:
- Pending File Information: References to files that are in the “pending” state, File paths, Creation timestamps, Size information, Target final locations
- In-Progress File Information: References to files that were being written at the time of the checkpoint: Current paths, Current sizes, Open file handles (conceptually), etc.
// Sample Filesink Code public class DataS3Sink { private static FileSink<ProcessedUserData> sink; private static final ObjectMapper objectMapper = new ObjectMapper(); private static final Logger log = LoggerFactory.getLogger(DataS3Sink.class); private DataS3Sink() {} public static synchronized FileSink<ProcessedUserData> getSink() { if (Objects.isNull(sink)) { log.debug("Creating S3 sink for processed user data"); String s3BasePath = "s3a://adhoc-bucket/adhoc-path-s3/"; // The s3a:// protocol is more modern and might work better with your Hadoop configuration. // Configure output files OutputFileConfig fileConfig = OutputFileConfig .builder() .withPartPrefix("user-data-") .withPartSuffix(".json") .build(); // Create the FileSink with a custom Encoder sink = FileSink .forRowFormat( new Path(s3BasePath), new Encoder<ProcessedUserData>() { @Override public void encode(ProcessedUserData element, OutputStream stream) throws IOException { try { String json = objectMapper.writeValueAsString(element); log.debug("Writing data to S3 of {} length)", json.length()); stream.write(json.getBytes(StandardCharsets.UTF_8)); stream.write('\n'); log.debug("Successfully flushed data to sink"); } catch (Exception e) { log.error("Error serializing user data", e); throw new IOException("Error serializing user data", e); } } } ) .withBucketAssigner(new DateTimeBucketAssigner<>("yyyy-MM-dd")) .withRollingPolicy( DefaultRollingPolicy.builder() .withRolloverInterval(5000) // Roll every 5 seconds .withInactivityInterval(5000) // Roll after 5s inactivity .withMaxPartSize(1024) // Roll after 1KB .build() ) .withOutputFileConfig(fileConfig) .build(); // Todo: Note that above withRollingPolicy() configuration should be relaxed if productionized. } return sink; } } // Note: To enable checkpointing: env.enableCheckpointing(checkpointIntervalMinutes * 60 * 1000); // Takes millisec as input- Unlike S3 sink, Kafka sink can work without explicit checkpointing. Few points:
- Kafka itself provides durability by storing messages on disk, once its accepted it, its considered saved; FileSink, by contrast, needs checkpointing to ensure data is properly committed to S3
- Kafka sink by default uses a “at-least-once” delivery guarantee; It doesn’t need to coordinate commit points across the job, but to have “exactly-once” semantics, you would need to enable both checkpointing and transactions in the Kafka sink as well added reference in next points.
- KafkaSink forwards data immediately to Kafka brokers; FileSink writes to local temporary files first, then coordinates their movement to the final destination
- At most once, at least once, exactly once principle: ref
- At-most once:It means a message will be delivered not more than once. Messages may be lost but are not redelivered.
- At-least once: It means it’s acceptable to deliver a message more than once, but no message should be lost.
- Exactly once: It is most difficult to implement and just like the name suggests. It is especially important when duplication is not acceptable and the downstream service doesn’t support idempotency.
- When we say “exactly-once semantics”, what we mean is that each incoming event affects the final results exactly once. Exactly once applies to the whole ecosystem of connected components. Even in case of a machine or software failure, there’s no duplicate data and no data that goes unprocessed. Flink’s Exactly Once: ref
- Other Flink functions:
- SingleOutputStream + RichAsyncFunction + Sideoutput combined example:
-
In short, function takes input stream does some processing and returns output stream. If any error is popped up, it is handled in a side stream. Sample eg:
Eg:

public class UpdateUser extends RichAsyncFunction<UserEvent, Either<ProcessingResult, GenericException>> {
@Override
public void asyncInvoke(UserEvent event, ResultFuture<Either<ProcessingResult, GenericException>> future) throws Exception {
try {
          // Some business logic...
          ProcessingResult output = new ProcessingResult(processedUserData, msg);
          future.complete(Collections.singletonList(Either.Left(output)));
      } catch (Exception e) {
          GenericException ex = new GenericException(event, e);
          future.complete(Collections.singletonList(Either.Right(ex)));
          return;
      }
    }
}

private SingleOutputStreamOperator<ProcessingResult> updateUserDetails(DataStream<UserEvent> events) {
        SingleOutputStreamOperator<Either<ProcessingResult, GenericException>> results = AsyncDataStream.unorderedWait(
                events,
                new UpdateUser(),
                600000, TimeUnit.MILLISECONDS
        ).name(UPDATE_USER_OPERATOR);
        return results.process(
                new ProcessFunction<>() {
                    /*
                        The ProcessFunction is a low-level function that provides fine-grained control over the processing of elements in Flink. We are processing the output of the async function call to update user. If the result is successful, we collect the ProcessingResult. If the result is a failure, we output the GenericException to the side output stream.
                     */
                    private static final long serialVersionUID = -8056509330481115777L;
                    /*
                        The serialVersionUID is a unique identifier for each class that implements the Serializable interface. It is used during the deserialization process to ensure that a loaded class corresponds exactly to a serialized object. If the serialVersionUID of the loaded class does not match the serialVersionUID of the serialized object, an InvalidClassException is thrown.
                        In simple words, Java uses this ID to verify that the serialized and deserialized objects are compatible. It helps in version control of the serialized classes. If you modify the class structure (e.g., add/remove fields), you can change the serialVersionUID to indicate that the new version is incompatible with the old serialized objects.
                        If you do not explicitly declare a serialVersionUID, the JVM will generate one at runtime based on various aspects of the class. This can lead to unexpected InvalidClassException if the class structure changes.
                     */
                    @Override
                    public void processElement(
                            Either<ProcessingResult, GenericException> output,
                            Context ctx,
                            Collector<ProcessingResult> collector) {
                        if (output.isLeft()) {
                            log.debug("Collecting ProcessingResult output");
                            collector.collect(output.left());
                        } else {
                            log.debug("Collecting GenericException output");
                            ctx.output(
                                    ExceptionTags.GENERIC_EXCEPTION_OUTPUT_TAG,
                                    output.right());
                        }
                    }
                });
    }

// Assuming got extractedEvents from kafka stream and now processing it
SingleOutputStreamOperator<ProcessingResult> results = updateUserDetails(extractedEvents);
results.getSideOutput(ExceptionTags.GENERIC_EXCEPTION_OUTPUT_TAG).process(new GenericExceptionRaiseAlertProcessor());
-
-
Sample Kafka as a source for Flink pipeline code:
public class EventsKafkaSource {
private static final Logger log = LoggerFactory.getLogger(EventsKafkaSource.class);
private static KafkaSource<JsonNode> source;
private static Object obj = new Object();
public static KafkaSource<JsonNode> getSource() throws IOException {
    log.debug("Setting up Kafka source");
    if (Objects.isNull(source)) {
        synchronized (obj) {
            if (Objects.isNull(source)) {
                final ApplicationConfig config = ApplicationContext.getContext().getApplicationConfig(); // Getting all application configs
                final OffsetsInitializer offset = OffsetsInitializer.committedOffsets(OffsetResetStrategy.LATEST);
                source = KafkaSource.<JsonNode>builder()
                                .setBootstrapServers(config.getKafkaBrokers())
                                .setTopics(config.getKafkaSourceTopics())
                                .setGroupId(config.getKafkaConsumerGroupIdentifier())
                                .setProperty("auto.commit.interval.ms", "100")
                                .setProperty("enable.auto.commit", "true")
                                .setProperty("max.poll.records", "500")
                                .setStartingOffsets(offset)
                                .setValueOnlyDeserializer(new JsonNodeSchema())
                                .build();
            }
        }
    }
    return source;
  }
}
// OffsetsInitializer.timestamp(long timestamp) in Apache Flink Kafka connector is used to initialize offsets in Kafka partitions based on a specified timestamp. This method returns an OffsetsInitializer that will set the initial offset for each partition to the offset of the first record whose timestamp is greater than or equal to the provided timestamp (in milliseconds).
// Hence, if we used: final OffsetsInitializer offset = OffsetsInitializer.timestamp(1678886400000L); -> This code will initialize the Kafka source to start reading from the first record in each partition whose timestamp is greater than or equal to March 15, 2023, 00:00:00 GMT.
// If we are dealing with IST, convert the IST time to epoch time in milliseconds and use that value.
- SingleOutputStream + RichAsyncFunction + Sideoutput combined example:
For interview preparation and other insights around Spark/Flink, you can follow below PDFs for brushup: